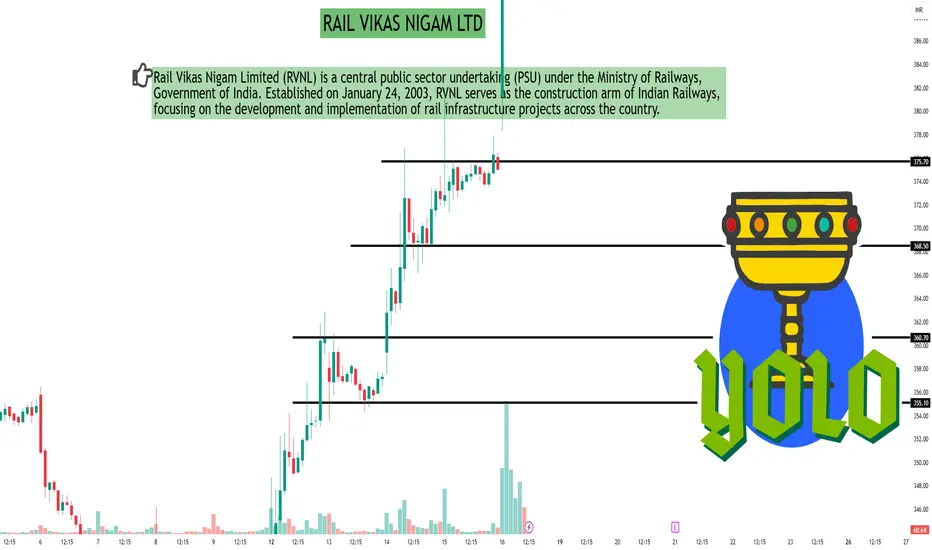
As of May 16, 2025, Rail Vikas Nigam Ltd. (NSE: RVNL) exhibits a bullish trend on the 30-minute timeframe, supported by several technical indicators:
📈 30-Minute Technical Analysis Summary
Current Price: ₹412.45
Relative Strength Index (RSI): 70.92
Indicates overbought conditions, suggesting strong upward momentum.
Moving Average Convergence Divergence (MACD): 2.89
Positive value supports the bullish trend.
Average Directional Index (ADX): 62.56
Reflects a strong trend strength.
Stochastic Oscillator: 78.09
Near overbought territory, indicating strong buying pressure.
Rate of Change (ROC): 0.972
Positive value aligns with upward price movement.
Supertrend: ₹372.14
Below current price, reinforcing the bullish outlook.
Parabolic SAR (PSAR): ₹371.61
Below current price, indicating an uptrend.
Chaikin Money Flow (CMF): 0.216
Positive value suggests buying pressure.
📊 TradingView Technical Summary (30-Minute Timeframe)
On TradingView, the 30-minute technical indicators for RVNL present a Neutral outlook, suggesting a balance between bullish and bearish signals.
⚠️ Trading Considerations
Overbought Indicators:
RSI and Stochastic values suggest the stock is in overbought territory; traders should watch for potential pullbacks.
Support Levels:
Supertrend and PSAR levels around ₹372 may act as support in case of a price correction.
Volume Analysis:
Monitoring volume trends alongside price movements can provide additional insights into the strength of the current trend.
Hello Guys ..
WhatsApp link- wa.link/d997q0
Email - techncialexpress@gmail.com ...
Script Coder/Trader//Investor from India. Drop a comment or DM if you have any questions! Let’s grow together!
WhatsApp link- wa.link/d997q0
Email - techncialexpress@gmail.com ...
Script Coder/Trader//Investor from India. Drop a comment or DM if you have any questions! Let’s grow together!
Related publications
Disclaimer
The information and publications are not meant to be, and do not constitute, financial, investment, trading, or other types of advice or recommendations supplied or endorsed by TradingView. Read more in the Terms of Use.