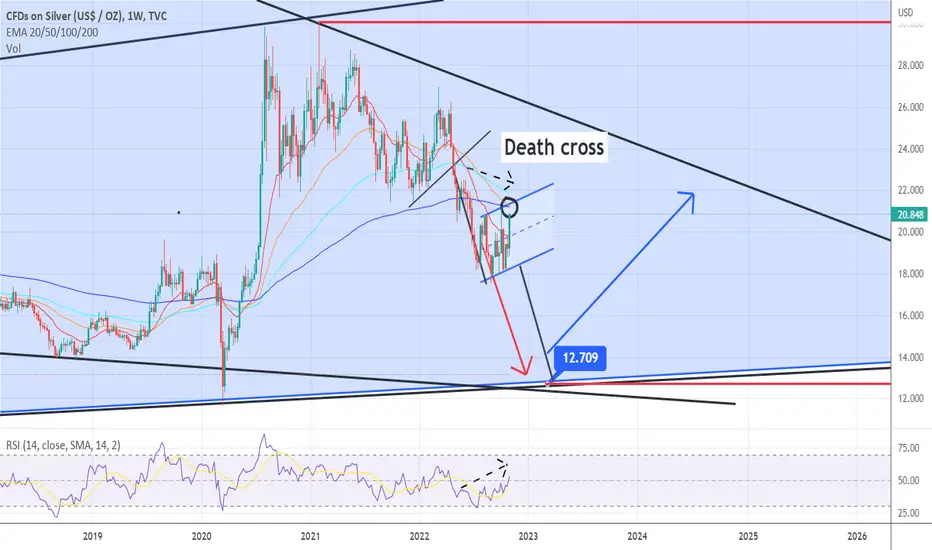
It's a closer look from my previous idea about Silver
So we can see a potential death cross (meaning the 50 crossing 200) (black circle)
a hidden bearish divergence (see that dashed arrows on the RSI and chart)
A bear flag, but the beginning i took from the break of that black trendline (meaning the lenght of the pole) and if we bring that pole line to the down part of the flag. It's also giving that target around 12,70 (BUT everything is depending when, where and IF it will break that flag below)
So a lot is giving bearish signals on silver (IMO)
IF we cross that 200 ema and using this as a support (so no fake out), then and only then we can speak about being bullish on silver
Disclaimer
The information and publications are not meant to be, and do not constitute, financial, investment, trading, or other types of advice or recommendations supplied or endorsed by TradingView. Read more in the Terms of Use.
Disclaimer
The information and publications are not meant to be, and do not constitute, financial, investment, trading, or other types of advice or recommendations supplied or endorsed by TradingView. Read more in the Terms of Use.