⸻
🔍 Chart Setup Overview
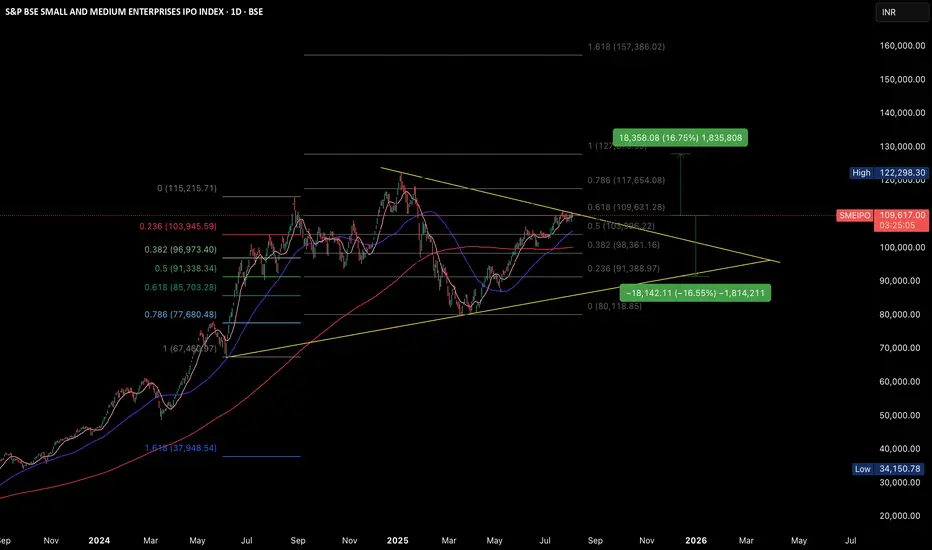
• Pattern: Symmetrical Triangle (consolidation zone — make-or-break pattern).
• Current Price: ₹109,635 (right at Fibonacci 0.618 level).
• Moving Averages: Clustered, indicating indecision.
• Key Levels (Fibonacci & Triangle) clearly suggest a breakout/breakdown zone.
⸻
📉 Downside Possibility (~60%)
📉 Upside Possibility (~40%)
Based on chart structure and current position near triangle resistance, downside has a higher probability unless a breakout happens soon.
✅ Targets:
1. 1st Downside Target: ₹91,388
• Corresponds to 0.236 Fibonacci level of the entire upmove.
• Drop of ~16.6% → ✔️ Your level is accurate.
2. 2nd Downside Target: ₹85,703
• 0.618 Retracement from the broader previous upmove.
• Drop of ~21.8% → ✔️ Your second target is also valid.
📌 Break below the triangle support would likely trigger both targets.
⸻
📈 Upside Possibility
If it breaks above the triangle resistance, the structure has good momentum potential:
✅ Upside Target:
• ₹127,873 (1.0 Fibonacci extension of previous top)
• Gain of ~16.7% → ✔️ Your upside target is correct.
🚩 But breakout must be confirmed with volume, else it’s a false breakout risk.
⸻
🔺 Conclusion: You are right.
• The risk-reward ratio slightly favors the downside unless there’s a convincing breakout.
• The 60% downside probability estimate is reasonable based on chart pattern, resistance levels, and trend weakening.
Disclaimer
The information and publications are not meant to be, and do not constitute, financial, investment, trading, or other types of advice or recommendations supplied or endorsed by TradingView. Read more in the Terms of Use.
Disclaimer
The information and publications are not meant to be, and do not constitute, financial, investment, trading, or other types of advice or recommendations supplied or endorsed by TradingView. Read more in the Terms of Use.