An interesting event was observed for this coin during the period from August 20th to 25th!
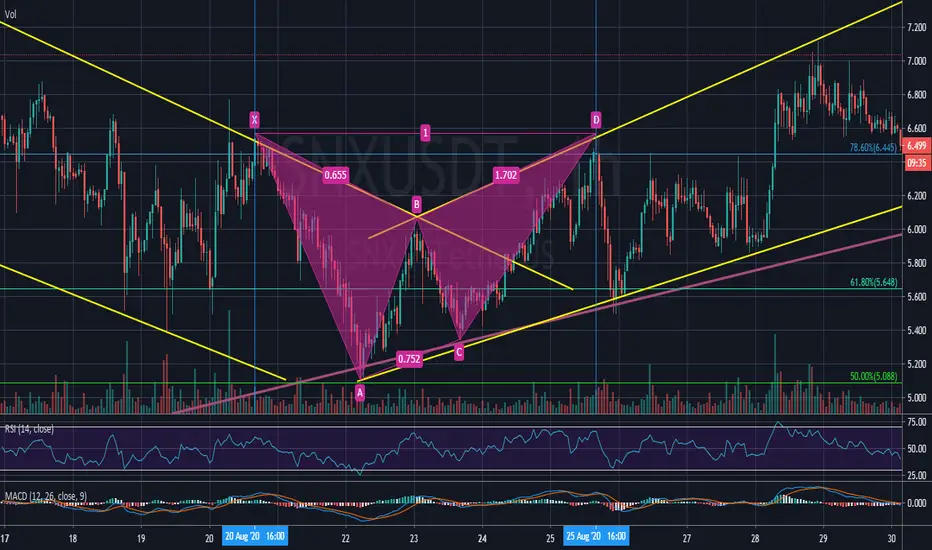
On August 20th, at 11:00 (UTC), the high price was $ 6,570.
Then, within 5 days, the XABCD pattern appeared on the chart. And what is interesting here is that at the end of this pattern, the high price reached $ 6,570 and at 11:00 (UTC).
After that, this pattern worked very well. By Fibonacci at 78.6%, the price reversed to fall and reached 61.8% Fibo.
Disclaimer
The information and publications are not meant to be, and do not constitute, financial, investment, trading, or other types of advice or recommendations supplied or endorsed by TradingView. Read more in the Terms of Use.
Disclaimer
The information and publications are not meant to be, and do not constitute, financial, investment, trading, or other types of advice or recommendations supplied or endorsed by TradingView. Read more in the Terms of Use.