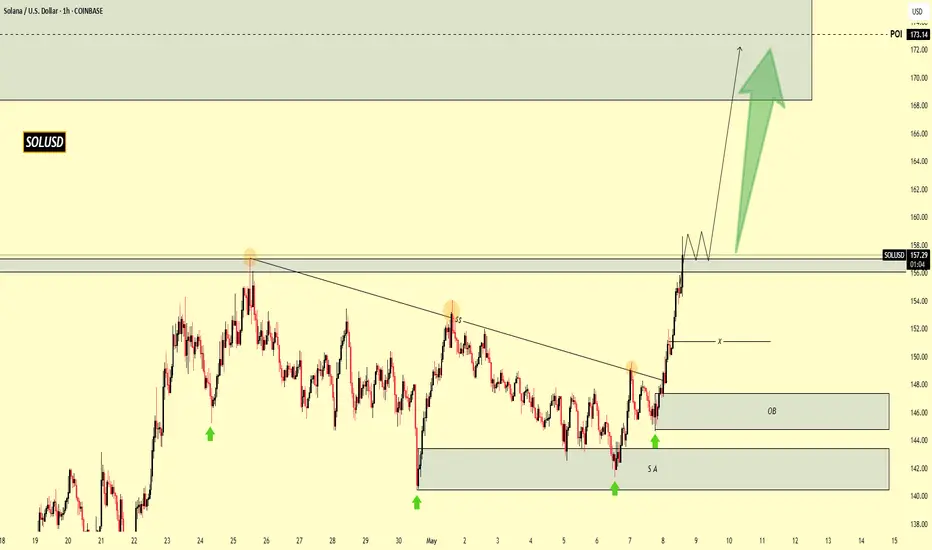
The Solana (SOL) cryptocurrency against the US Dollar (USD) on the Coin-base exchange. The chart is displayed on a 1-hour timeframe.
To analyze this chart, several tools are used:
1. Trend Lines: A downward trend line is drawn connecting the highs of the price action, indicating a bearish trend. The price has recently broken above this trend line, suggesting a potential reversal.
2. Support and Resistance Levels: Two horizontal blue zones are marked on the chart, labeled "S.A" ( likely "Supply Area" or a similar term) and "OB" ( possibly "Order Block"). These zones represent areas of potential support and resistance. The price has bounced off the lower zone ("S.A") and is now moving towards the upper zone ("OB").
3. Order Block (OB): The "OB" zone is likely an area where significant buying or selling activity has occurred in the past, making it a potential level of interest for traders.
4. Supply Area (S.A): The "S.A" zone is an area where the price has previously found support, and it may continue to act as a support level.
5. POI (Point of Interest): A zone labeled "POI" is marked above the current price, indicating a potential target or area of interest for traders.
The chart analysis suggests that the price has broken above the downward trend line and is expected to continue rising, potentially reaching the "POI" zone. The green arrow on the chart indicates the anticipated direction of the price movement.
Overall, the analysis tools used in this chart include trend lines, support and resistance levels, order blocks, and points of interest. These tools help traders identify potential trading opportunities and make informed decisions.
What you think about "SOLUSD", write your comment below.
Trade active
Disclaimer
The information and publications are not meant to be, and do not constitute, financial, investment, trading, or other types of advice or recommendations supplied or endorsed by TradingView. Read more in the Terms of Use.
Disclaimer
The information and publications are not meant to be, and do not constitute, financial, investment, trading, or other types of advice or recommendations supplied or endorsed by TradingView. Read more in the Terms of Use.