🔻 4-Hour Bearish Thesis
🔸 Price Action Clues
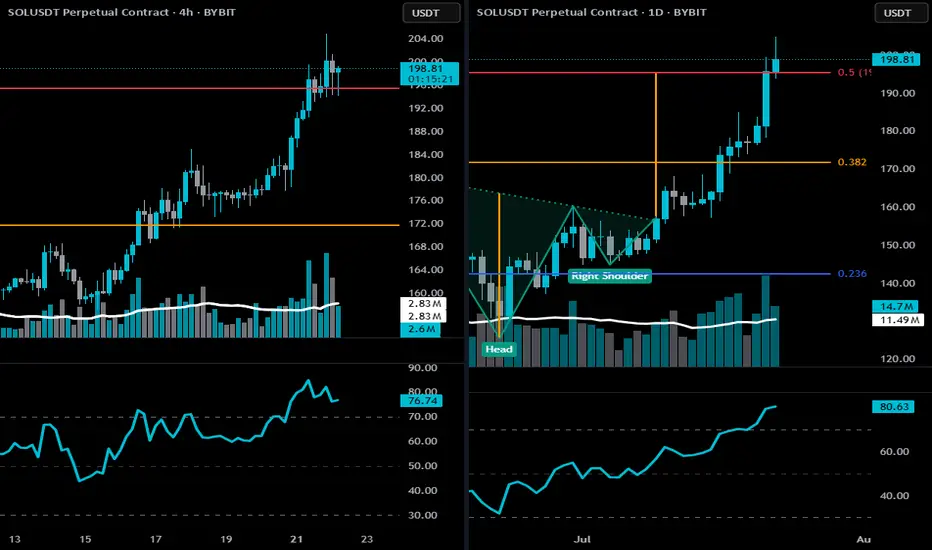
SOL is currently stalling at the 0.5 Fibonacci retracement (~$198.18) of the full macro move — a classic profit-taking zone.
Multiple upper wicks and indecisive candles at resistance indicate supply absorption and buyer exhaustion.
After a steep rally, price is moving sideways in a rising wedge/flag, which is a bearish continuation pattern if broken downward.
🔸 Momentum + RSI
RSI at 76 is extended and flattening — often a zone where short-term pullbacks begin.
No confirmed bearish divergence yet, but momentum is weakening compared to earlier stages of the rally.
🔸 Volume Profile
Volume on recent pushes is lower than during breakout, suggesting diminishing bullish conviction.
Bearish if a breakdown below $194 occurs — that's the former breakout level and wedge support.
🧨 4H Breakdown Confirmation
Break below $194 (key short-term support) → opens downside targets:
🔻 $186–$182 (prior breakout base)
🔻 $171 (0.382 Fib retracement zone)
🔻 Daily Bearish Thesis
🔸 Price Action + Key Zone
Price is pressing against the neckline target ($198.18) of the inverse H&S pattern.
Stalling under the red resistance line and 0.5 Fib.
Recent candle closed with a small upper wick + reduced body size, hinting at hesitation after a parabolic run.
🔸 RSI Risk
RSI is at 80.41 — very overbought on daily.
While not immediately bearish on its own, this often precedes either:
Sharp correction, or
Prolonged consolidation
🔸 Fibonacci & Macro Resistance
$198–$200 is a confluence zone of:
0.5 Fib retracement
Previous structural resistance
Measured target of inverse H&S pattern ALREADY HIT.
This is not a great spot to initiate new longs — any weakness here invites a pullback.
⚠️ Invalidation of Bearish Thesis
A strong daily close above $200–$204, ideally with expanding volume, would invalidate the bearish outlook and shift momentum toward $219 (0.618 Fib).
🧠 Summary:
Yes, there is a short-to-mid-term bearish risk developing on both 4h and daily:
Overbought RSI
Stalling at major Fib resistance
Decreasing momentum
Vulnerable if $194–$195 breaks
Remember: this WILL MOST LIKELY BE A SHORT-SHORT pullback, not a confirmed trend reversal… yet. BUT I'VE INITIATED A STARTING POSITION!
THIS IS NOT FINANCIAL ADVICE. DrAnkin Smöökëē Whizkee. Edumacational Purpiz Only!
🔸 Price Action Clues
SOL is currently stalling at the 0.5 Fibonacci retracement (~$198.18) of the full macro move — a classic profit-taking zone.
Multiple upper wicks and indecisive candles at resistance indicate supply absorption and buyer exhaustion.
After a steep rally, price is moving sideways in a rising wedge/flag, which is a bearish continuation pattern if broken downward.
🔸 Momentum + RSI
RSI at 76 is extended and flattening — often a zone where short-term pullbacks begin.
No confirmed bearish divergence yet, but momentum is weakening compared to earlier stages of the rally.
🔸 Volume Profile
Volume on recent pushes is lower than during breakout, suggesting diminishing bullish conviction.
Bearish if a breakdown below $194 occurs — that's the former breakout level and wedge support.
🧨 4H Breakdown Confirmation
Break below $194 (key short-term support) → opens downside targets:
🔻 $186–$182 (prior breakout base)
🔻 $171 (0.382 Fib retracement zone)
🔻 Daily Bearish Thesis
🔸 Price Action + Key Zone
Price is pressing against the neckline target ($198.18) of the inverse H&S pattern.
Stalling under the red resistance line and 0.5 Fib.
Recent candle closed with a small upper wick + reduced body size, hinting at hesitation after a parabolic run.
🔸 RSI Risk
RSI is at 80.41 — very overbought on daily.
While not immediately bearish on its own, this often precedes either:
Sharp correction, or
Prolonged consolidation
🔸 Fibonacci & Macro Resistance
$198–$200 is a confluence zone of:
0.5 Fib retracement
Previous structural resistance
Measured target of inverse H&S pattern ALREADY HIT.
This is not a great spot to initiate new longs — any weakness here invites a pullback.
⚠️ Invalidation of Bearish Thesis
A strong daily close above $200–$204, ideally with expanding volume, would invalidate the bearish outlook and shift momentum toward $219 (0.618 Fib).
🧠 Summary:
Yes, there is a short-to-mid-term bearish risk developing on both 4h and daily:
Overbought RSI
Stalling at major Fib resistance
Decreasing momentum
Vulnerable if $194–$195 breaks
Remember: this WILL MOST LIKELY BE A SHORT-SHORT pullback, not a confirmed trend reversal… yet. BUT I'VE INITIATED A STARTING POSITION!
THIS IS NOT FINANCIAL ADVICE. DrAnkin Smöökëē Whizkee. Edumacational Purpiz Only!
Trade active
TARGET-TP 1 = $178 For crypto charts, trading insight and the patterns in my head.
Follow on X: @TheAlphaView
🧠Stay Sharp! Stack Sats!🪙
Follow on X: @TheAlphaView
🧠Stay Sharp! Stack Sats!🪙
Related publications
Disclaimer
The information and publications are not meant to be, and do not constitute, financial, investment, trading, or other types of advice or recommendations supplied or endorsed by TradingView. Read more in the Terms of Use.
For crypto charts, trading insight and the patterns in my head.
Follow on X: @TheAlphaView
🧠Stay Sharp! Stack Sats!🪙
Follow on X: @TheAlphaView
🧠Stay Sharp! Stack Sats!🪙
Related publications
Disclaimer
The information and publications are not meant to be, and do not constitute, financial, investment, trading, or other types of advice or recommendations supplied or endorsed by TradingView. Read more in the Terms of Use.