Overview:
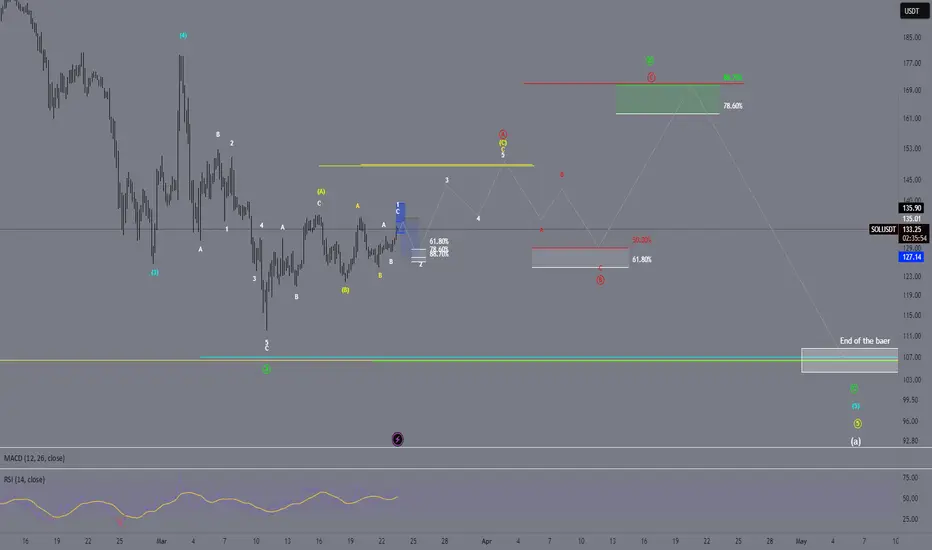
This analysis examines Solana’s current Elliott Wave structure. The chart suggests a potential correction (blue zone), followed by a strong upward impulse (Wave 3), and later a larger ABC corrective phase (red letters) before potentially resuming a bullish trend.
1. Short-Term Scenario (Blue Zone)
- Complex Correction: The price has recently undergone a multi-wave correction and is approaching a potential buying zone.
- Fibonacci Levels: Zones around 61.8% and 78.6% may act as support levels where the correction could end.
- Entry Opportunity: If the price tests these levels and shows signs of forming a base, this could be a favorable entry point.
2. Next Upward Impulse (Wave 3)
- Strong Move: Once the correction concludes, an impulsive upward movement (Wave 3) could kick off, typically the most dynamic leg in an Elliott Wave cycle.
- Target Area: The highlighted yellow zone in the chart indicates a key resistance level that the market could aim to hit.
3. Mid-Term ABC Correction (Red Waves)
- After the Impulse: Once the impulsive upward move (Wave 5) completes, a larger ABC corrective phase is expected (denoted by red letters).
- Retracement Levels: Fibonacci retracement levels around 50% or 61.8% may serve as critical support zones during this correction.
4. Long-Term Perspective
- Renewed Bullish Trend: Following the completion of the ABC correction, there is the potential for Solana to resume its bullish trajectory.
- Target Zone: The green area in the upper section of the chart represents a possible long-term resistance or target level where a significant market decision could take place.
Conclusion:
- Short-Term: A correction toward the blue zone is possible, which may offer a good entry opportunity if support holds.
- Mid-Term: A robust upward impulse toward the yellow resistance is anticipated, likely followed by a larger ABC correction.
- Long-Term: Once the correction completes, Solana could resume an upward trend, setting the stage for a new bullish phase.
- Disclaimer: This analysis is for educational purposes only and should not be considered financial or investment advice. Always practice proper risk management when trading.
Trade active
We are currently hovering just a few dollars below the yellow 100% and blue 161.8% Fibonacci extension levels. There is a high probability of a downward move.
Order cancelled
counting is not valid anymoreDisclaimer
The information and publications are not meant to be, and do not constitute, financial, investment, trading, or other types of advice or recommendations supplied or endorsed by TradingView. Read more in the Terms of Use.
Disclaimer
The information and publications are not meant to be, and do not constitute, financial, investment, trading, or other types of advice or recommendations supplied or endorsed by TradingView. Read more in the Terms of Use.