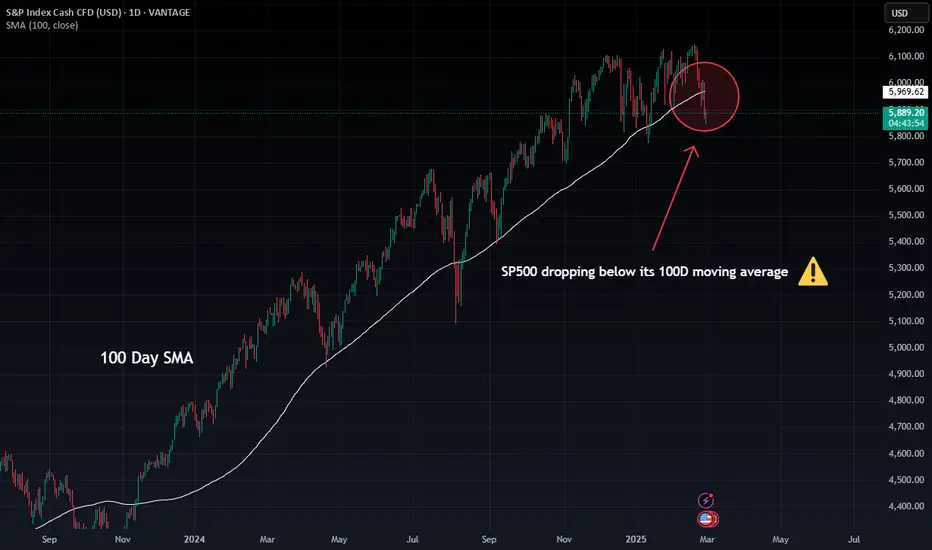
The S&P 500 has broken below its 100-day simple moving average (SMA), a key technical level that many traders and institutions use to gauge trend strength. Historically, when the price falls below this moving average, it often signals a potential shift in market sentiment.
What This Means:
🔹 Potential Trend Reversal? If the index fails to recover above this level, we could see increased selling pressure, leading to further downside.
🔹 Bearish Confirmation: A sustained close below this moving average might attract more short sellers, reinforcing a downward move.
🔹 Buying Opportunity? If buyers step in and reclaim the 100-day SMA, this could be a temporary dip before resuming the uptrend.
Are we looking at the start of a deeper correction or just a pullback before new highs? Let’s see how the market reacts!
#SP500 #TechnicalAnalysis #MovingAverages #TradingStrategy
Disclaimer
The information and publications are not meant to be, and do not constitute, financial, investment, trading, or other types of advice or recommendations supplied or endorsed by TradingView. Read more in the Terms of Use.
Disclaimer
The information and publications are not meant to be, and do not constitute, financial, investment, trading, or other types of advice or recommendations supplied or endorsed by TradingView. Read more in the Terms of Use.
