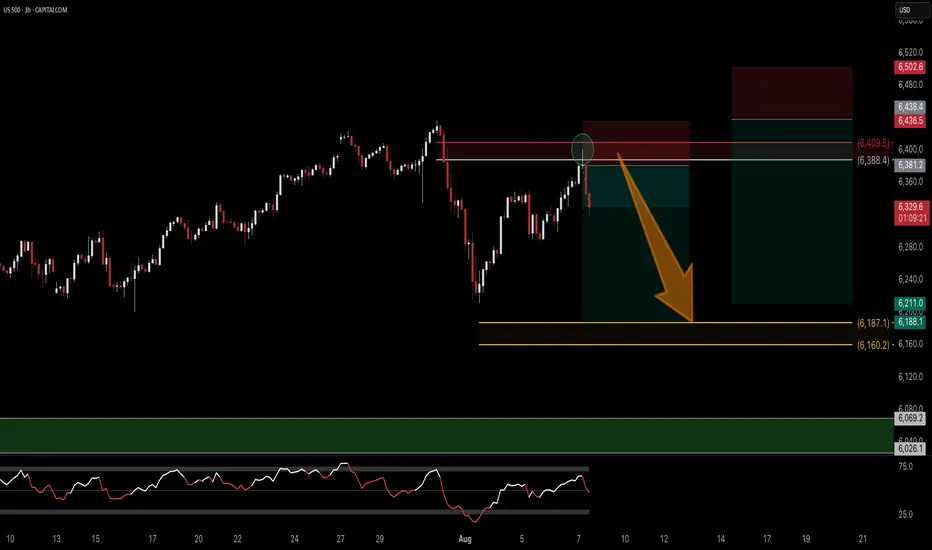
US500 Needs retracementVery good opportunity to sell above 6400... and then i expect it to touch 6085

Hellena | SPX500 (4H): LONG to resistance area of 6596 .Dear colleagues, I haven't made a forecast for the SNP500 in a long time and was waiting for a correction, but it seems that a major correction is not yet close, and at the moment the price continues to be in an upward five-wave movement.
Therefore, I believe that we should expect to reach the 6596

S&P 500 Bearish Pennant Signals Potential Downside MoveThe S&P 500 Index (SPX) is forming a bearish pennant pattern on the 30-minute chart, suggesting possible continuation of the recent downtrend. Price action is consolidating within converging trendlines after a sharp drop, with a breakdown below support near 6,360 potentially opening the door to furt

Lower High Complete?OFC earnings provided buys a good level to pick up price but POC at 6375 was key.
The 4HR shows and englufing with LH partially complete.
Bias is Short!

US500 Bearish Idea: Waiting for Structure Break ConfirmationWatching the SPX US500 right now 📈 — it’s rallied hard with strong momentum and is pushing into a key resistance level ⚠️. Since price is overextended, I’m expecting a pullback towards equilibrium on the current move 🔄. My bias is bearish from this level 🔻, with entry dependent on a break in structu

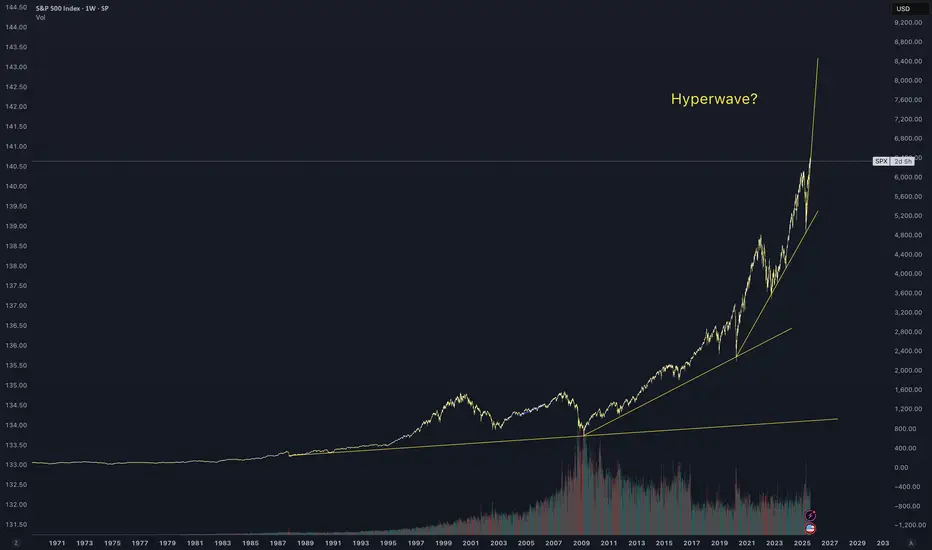
The Stock Market History Says…The Stock Market History Says…
When Capital Rotation Events (CRE) hit, stocks stall & gold outperforms.
Past (1949, 1974, 2009) hints at a retest of the 300-month MA before the next big leg up, maybe around 2036.
Watch GOLD vs SPX for the signal.

S&P 500 Bullish Rounding Bottom in PlayS&P 500 continues its upward trajectory, supported by a clearly defined rounding bottom formation. Price has successfully broken above the neckline resistance, followed by a technical pullback which was met with a strong buy reaction, validating this zone as a key demand area.
This pullback area no

SP500 | Short | 3hrsThis technical analysis is for informational and educational purposes only. It does not constitute financial advice. Remember to always research and consult with a professional before making investment decisions. Good luck! 📈💼🚀
S&P500 Channel Up going straight to 6670.The S&P500 index (SPX) has been trading within a 3-month Channel Up since the May 12 candle. All of this time, it has been supported by the 1D MA50 (blue trend-line) and as long as it holds, the new Bullish Leg is expected.
The last two rose by +7.06%, and ahead of a new 1D MACD Bullish Cross, that

See all ideas
Displays a symbol's price movements over previous years to identify recurring trends.
Frequently Asked Questions
S&P Index Cash CFD (USD) reached its highest quote on Jul 31, 2025 — 6,439.63 USD. See more data on the S&P Index Cash CFD (USD) chart.
The lowest ever quote of S&P Index Cash CFD (USD) is 2,177.62 USD. It was reached on Mar 23, 2020. See more data on the S&P Index Cash CFD (USD) chart.
S&P Index Cash CFD (USD) is just a number that lets you track performance of the instruments comprising the index, so you can't invest in it directly. But you can buy S&P Index Cash CFD (USD) futures or funds or invest in its components.