The 15-year cycle from 2008 to 2023 SP500
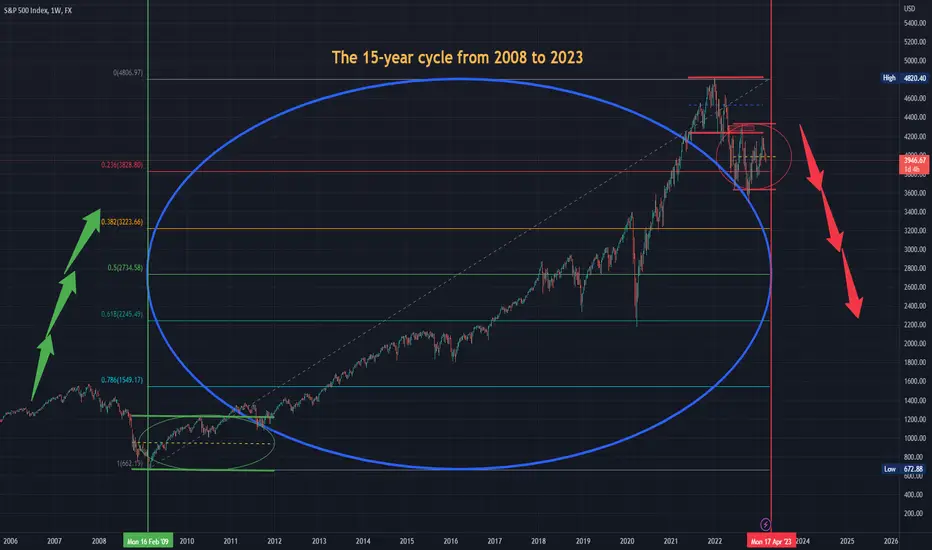
The 15-year cycle from 2008 to 2023, which fits perfectly into a sphere and a square on fibo rate levels. Technical analysis of price actions with accumulation and distribution sequences
The 15-year cycle from 2008 to 2023, which fits perfectly into a sphere and a square on fibo rate levels. Technical analysis of price actions with accumulation and distribution sequences
Disclaimer
The information and publications are not meant to be, and do not constitute, financial, investment, trading, or other types of advice or recommendations supplied or endorsed by TradingView. Read more in the Terms of Use.
Disclaimer
The information and publications are not meant to be, and do not constitute, financial, investment, trading, or other types of advice or recommendations supplied or endorsed by TradingView. Read more in the Terms of Use.