SPY at the Edge of Breakdown or Bounce? Watch These Gamma & Structure Levels Closely 🔥
🔹 GEX Insights for Options Trading (1H GEX Chart):
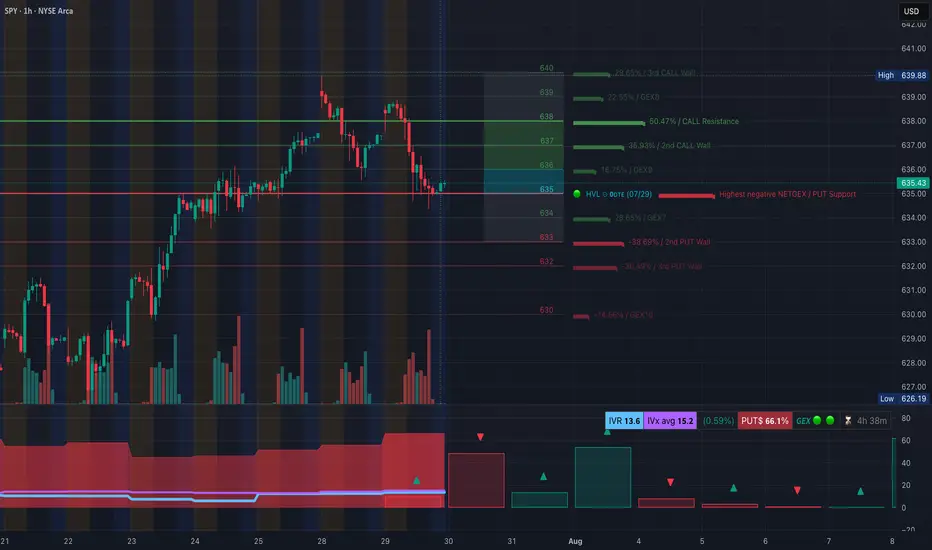
SPY currently sits at $635.43, hovering just above the highest negative GEX level at $635, which often acts as short-term PUT support or a reversal trigger when price reaches exhaustion.
The most concentrated CALL gamma cluster sits between $637 and $640, with the strongest resistance at $638 (50.47% GEX level) and $639 (2nd CALL Wall). These levels could magnetize price in a squeeze but also act as rejection zones if not broken with force.
Below, strong PUT gamma walls are stacked at:
* $633 (2nd PUT wall, -38.69%)
* $632 (3rd PUT wall, -30.49%)
* $630 (GEX10 level, -14.66%) These act as liquidity targets for downside expansion if bears push through.
Options Oscillator:
* PUTS dominant at 66.1%
* IVR: 13.6 (low, potential for future expansion)
* GEX: Green, indicating slight bullish gamma tilt short-term → Watch for volatility expansion if this support zone fails.
📌 Gamma Summary:
* As long as SPY holds above $635, a bounce toward $638–640 remains on table.
* Below $635, a flush into $633–630 becomes the next logical destination.
* IV crush seems done—next move likely gets direction from a volatility expansion event.
🔹 1-Hour Intraday Technical Analysis (Price Action + SMC):

SPY shows clear structural weakness after the Break of Structure (BOS) to the downside followed by a Change of Character (ChOCH) confirming a shift to bearish order flow.
The most recent rally was capped at a supply zone (highlighted in purple) near $639–640, where we saw consistent selling and volume exhaustion.
Currently, price is:
* Resting on the ascending trendline from July 23rd
* Approaching a demand zone around $632–630, which aligns with GEX support zones.
What to watch:
* A clean reclaim above $636.94 (local BOS level) could open a path for bullish retest of $638.88.
* If SPY loses $634.50, we likely dive into the next demand zone at $630, then possibly $628.00 or even $626.19.
This structure sets up a binary setup:
* Either we bounce from here and reclaim $636+ or,
* We continue the breakdown toward lower liquidity zones.
🎯 Suggested Option Plays (based on TA + GEX):
Bullish Scenario:
* CALL entry: On break and hold above $637 with volume
* Target: $639.88 → $640
* Stop: Below $635.20
Bearish Scenario:
* PUT entry: If SPY rejects at $636.94 or fails $634
* Target: $632 → $630 → $628.00
* Stop: Above $637
Scalpers can play both sides using tight risk around the gamma pivot at $635.
Conclusion: SPY is teetering at a high-confluence pivot zone where GEX support, structure demand, and trendline meet. Whichever side breaks first—above $637 or below $634—will likely dictate the next wave of directional momentum.
Stay reactive, not predictive. Use the GEX zones to frame your trade ideas and execute only on confirmation.
Disclaimer: This analysis is for educational purposes only and does not constitute financial advice. Always do your own research and manage your risk before trading.
🔹 GEX Insights for Options Trading (1H GEX Chart):
SPY currently sits at $635.43, hovering just above the highest negative GEX level at $635, which often acts as short-term PUT support or a reversal trigger when price reaches exhaustion.
The most concentrated CALL gamma cluster sits between $637 and $640, with the strongest resistance at $638 (50.47% GEX level) and $639 (2nd CALL Wall). These levels could magnetize price in a squeeze but also act as rejection zones if not broken with force.
Below, strong PUT gamma walls are stacked at:
* $633 (2nd PUT wall, -38.69%)
* $632 (3rd PUT wall, -30.49%)
* $630 (GEX10 level, -14.66%) These act as liquidity targets for downside expansion if bears push through.
Options Oscillator:
* PUTS dominant at 66.1%
* IVR: 13.6 (low, potential for future expansion)
* GEX: Green, indicating slight bullish gamma tilt short-term → Watch for volatility expansion if this support zone fails.
📌 Gamma Summary:
* As long as SPY holds above $635, a bounce toward $638–640 remains on table.
* Below $635, a flush into $633–630 becomes the next logical destination.
* IV crush seems done—next move likely gets direction from a volatility expansion event.
🔹 1-Hour Intraday Technical Analysis (Price Action + SMC):
SPY shows clear structural weakness after the Break of Structure (BOS) to the downside followed by a Change of Character (ChOCH) confirming a shift to bearish order flow.
The most recent rally was capped at a supply zone (highlighted in purple) near $639–640, where we saw consistent selling and volume exhaustion.
Currently, price is:
* Resting on the ascending trendline from July 23rd
* Approaching a demand zone around $632–630, which aligns with GEX support zones.
What to watch:
* A clean reclaim above $636.94 (local BOS level) could open a path for bullish retest of $638.88.
* If SPY loses $634.50, we likely dive into the next demand zone at $630, then possibly $628.00 or even $626.19.
This structure sets up a binary setup:
* Either we bounce from here and reclaim $636+ or,
* We continue the breakdown toward lower liquidity zones.
🎯 Suggested Option Plays (based on TA + GEX):
Bullish Scenario:
* CALL entry: On break and hold above $637 with volume
* Target: $639.88 → $640
* Stop: Below $635.20
Bearish Scenario:
* PUT entry: If SPY rejects at $636.94 or fails $634
* Target: $632 → $630 → $628.00
* Stop: Above $637
Scalpers can play both sides using tight risk around the gamma pivot at $635.
Conclusion: SPY is teetering at a high-confluence pivot zone where GEX support, structure demand, and trendline meet. Whichever side breaks first—above $637 or below $634—will likely dictate the next wave of directional momentum.
Stay reactive, not predictive. Use the GEX zones to frame your trade ideas and execute only on confirmation.
Disclaimer: This analysis is for educational purposes only and does not constitute financial advice. Always do your own research and manage your risk before trading.
Disclaimer
The information and publications are not meant to be, and do not constitute, financial, investment, trading, or other types of advice or recommendations supplied or endorsed by TradingView. Read more in the Terms of Use.
Disclaimer
The information and publications are not meant to be, and do not constitute, financial, investment, trading, or other types of advice or recommendations supplied or endorsed by TradingView. Read more in the Terms of Use.