People often ask me how I go about executing my short positions (SQ/FB most recently), especially when the company's fundamental story is solid.
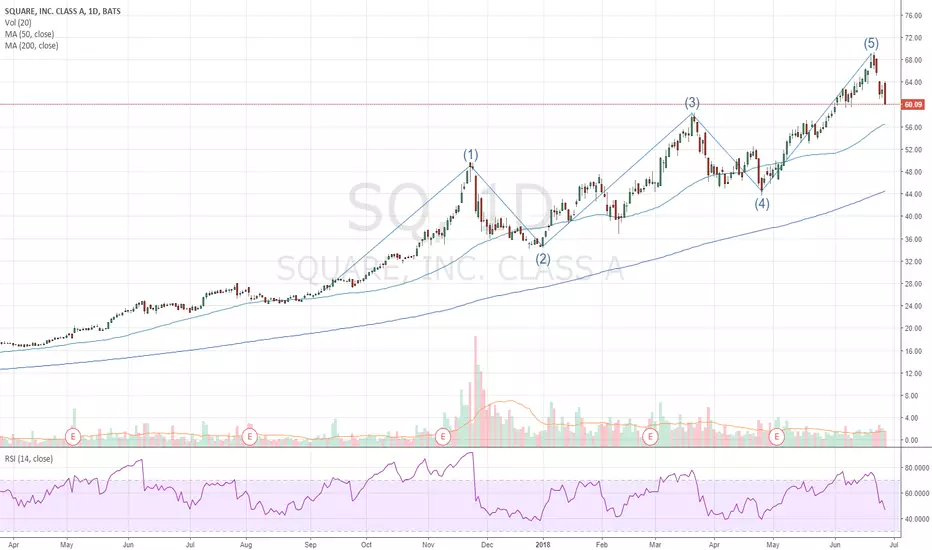
I typically show them charts like this, where, as you can see, just by applying very basic technicals you can see that this stock (SQ) has a pattern of what can only be described as euphoric run-ups, followed by intense profit taking and shorts stepping in. I missed the first two short opportunities (wave 1/3) as I was patiently watching the price action. After seeing shares rally +1% per day in June and seeing the price action near the top begin to fade (wave 5), I entered a short (via puts) on 6/22 and am currently still in the trade.
I'm up ~145% as of 6/27/2018. Planning on closing this position when shares hit about $57-$55 (may close sooner depending on volume).
Long term, a company like SQ is solid, but I often say "watch out for euphoric run-ups, they end the same way every time". Just go check out a chart of AMBA or BTC.
The first idea published, just wanted to share some of my thoughts.
Let me know what you think :-)
Cheers!
Trade closed manually
Closed position this morning (7/2/18) - total gain of 103%. Gave some of the gains away, but very happy with the return. Markets look set up to rally short-term. I still suspect some more weakness before earnings, at which time I will look at call options.
Note
SQ has been on an epic run-up, but once again it's in overbought territory. Just opened the 9/7/18 $85 Puts.
Disclaimer
The information and publications are not meant to be, and do not constitute, financial, investment, trading, or other types of advice or recommendations supplied or endorsed by TradingView. Read more in the Terms of Use.
Disclaimer
The information and publications are not meant to be, and do not constitute, financial, investment, trading, or other types of advice or recommendations supplied or endorsed by TradingView. Read more in the Terms of Use.