As of the close on May 16, 2025, Swan Energy Ltd. (NSE: SWANENERGY) ended the trading day at ₹455.00. Based on daily technical analysis and pivot point calculations, here are the key support and resistance levels to consider:
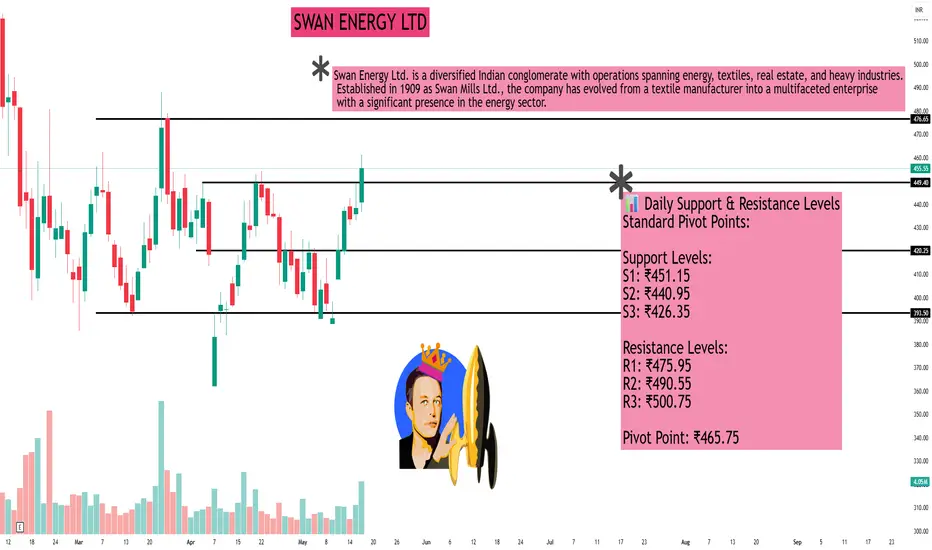
📊 Daily Support & Resistance Levels
Standard Pivot Points:
Support Levels:
S1: ₹451.15
S2: ₹440.95
S3: ₹426.35
Resistance Levels:
R1: ₹475.95
R2: ₹490.55
R3: ₹500.75
Pivot Point: ₹465.75
Fibonacci Retracement Levels (from recent downtrend):
Support Levels:
23.6%: ₹391.87
38.2%: ₹410.22
50%: ₹425.05
61.8%: ₹439.88
76.4%: ₹458.23
Resistance Levels:
23.6%: ₹425.88
38.2%: ₹407.53
50%: ₹392.70
61.8%: ₹377.87
76.4%: ₹359.52
Accumulated Volume Support & Resistance:
Support Levels:
S1: ₹442.45
S2: ₹434.55
S3: ₹430.25
Resistance Level:
R1: ₹472.85
📈 Technical Indicators Overview
Relative Strength Index (RSI): 72.385 (indicates overbought conditions)
MACD: 7.690 (suggests bullish momentum)
5-Day Moving Average: ₹448.94
50-Day Moving Average: ₹424.67
These indicators suggest that while the stock is currently experiencing bullish momentum, the RSI indicates it may be overbought, which could lead to a short-term pullback.
🔍 Trading Insights
The immediate support level at ₹442.45 is crucial; a break below this could signal further downside.
On the upside, resistance at ₹472.85 is significant; a break above this could indicate continued bullish momentum.
Given the current RSI and MACD readings, traders should exercise caution and monitor for potential reversals or consolidations.
Hello Guys ..
WhatsApp link- wa.link/d997q0
Email - techncialexpress@gmail.com ...
Script Coder/Trader//Investor from India. Drop a comment or DM if you have any questions! Let’s grow together!
WhatsApp link- wa.link/d997q0
Email - techncialexpress@gmail.com ...
Script Coder/Trader//Investor from India. Drop a comment or DM if you have any questions! Let’s grow together!
Related publications
Disclaimer
The information and publications are not meant to be, and do not constitute, financial, investment, trading, or other types of advice or recommendations supplied or endorsed by TradingView. Read more in the Terms of Use.