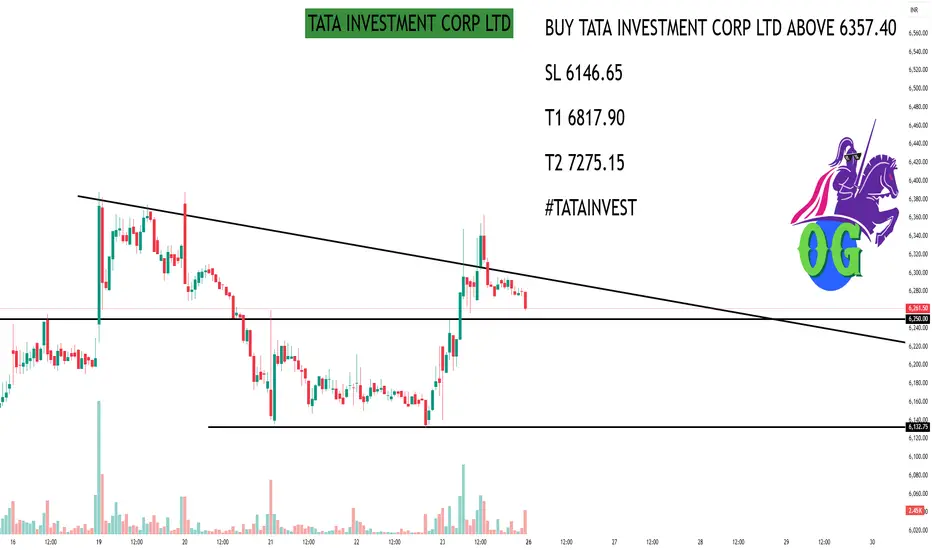
As of May 26, 2025, Tata Investment Corporation Ltd. (NSE: TATAINVEST) closed at ₹6,269.00. Here's an overview of its 15-minute intraday support and resistance levels based on technical analysis:
📊 15-Minute Intraday Support & Resistance Levels
While specific 15-minute pivot points are not readily available, we can refer to the daily pivot levels as a proxy for intraday analysis:
Classic Pivot Points:
Pivot Point (P): ₹6,257.33
Resistance Levels:
R1: ₹6,374.66
R2: ₹6,480.33
R3: ₹6,597.66
Support Levels:
S1: ₹6,151.66
S2: ₹6,034.33
S3: ₹5,928.66
These levels can serve as reference points for intraday trading decisions.
🔍 Technical Indicators Overview
RSI (14-day): 57.56 — indicating neutral momentum.
MACD: 27.09 — suggesting bullish momentum.
Stochastic Oscillator: 72.08 — approaching overbought territory.
Supertrend Support: ₹5,861.93 — acting as a dynamic support level.
Parabolic SAR: ₹5,842.13 — indicating an upward trend.
These indicators suggest a cautiously bullish outlook for the short term.
📈 Trading Strategy Insights
Bullish Scenario: A breakout above ₹6,374.66 (R1) with strong volume could signal further upward momentum.
Bearish Scenario: A drop below ₹6,151.66 (S1) may indicate potential downside risk.
Traders should monitor these levels closely and consider additional technical indicators for confirmation.
Hello Guys ..
WhatsApp link- wa.link/d997q0
Email - techncialexpress@gmail.com ...
Script Coder/Trader//Investor from India. Drop a comment or DM if you have any questions! Let’s grow together!
WhatsApp link- wa.link/d997q0
Email - techncialexpress@gmail.com ...
Script Coder/Trader//Investor from India. Drop a comment or DM if you have any questions! Let’s grow together!
Related publications
Disclaimer
The information and publications are not meant to be, and do not constitute, financial, investment, trading, or other types of advice or recommendations supplied or endorsed by TradingView. Read more in the Terms of Use.