As of May 16, 2025, Tata Motors Ltd. (NSE: TATAMOTORS) is trading at approximately ₹735.00. Here's a detailed analysis of its support and resistance levels on the 4-hour timeframe, along with insights from technical indicators and chart patterns.
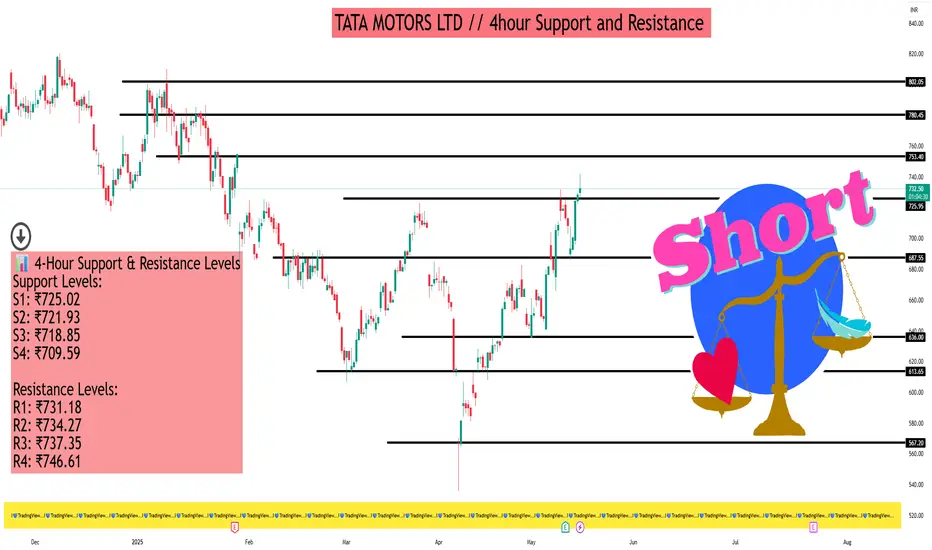
📊 4-Hour Support & Resistance Levels
Support Levels:
S1: ₹725.02
S2: ₹721.93
S3: ₹718.85
S4: ₹709.59
Resistance Levels:
R1: ₹731.18
R2: ₹734.27
R3: ₹737.35
R4: ₹746.61
These levels are derived from Camarilla pivot calculations and provide key price points where the stock may experience buying or selling pressure.
📈 Technical Indicators Overview
Relative Strength Index (RSI): 68.4 — approaching overbought territory, suggesting potential for a short-term pullback.
MACD (12,26): 8.69 — indicates bullish momentum.
Average Directional Index (ADX): 42.07 — reflects a strong trend strength.
Stochastic Oscillator: 76.29 — nearing overbought levels, which may signal a potential reversal.
Commodity Channel Index (CCI): 103.31 — suggests the stock is in a strong uptrend.
These indicators collectively point towards a bullish trend, but caution is advised due to overbought signals.
🔍 Chart Patterns & Price Action
Recent analyses indicate that Tata Motors has formed a Shark pattern, with potential resistance in the ₹850 to ₹900 range. Short-term targets include ₹700, ₹750, ₹780, ₹820, ₹860, and ₹900. A weekly candle close above ₹900 could signal further upside potential.
Additionally, Elliott Wave analysis suggests that the stock may have completed a Wave (5) near ₹1180, with a potential decline towards the ₹850 level as part of a corrective phase.
🧭 Trading Strategy Insights
Bullish Scenario: If the stock sustains above ₹737.35 (R3), it may target higher resistance levels, with ₹746.61 (R4) being a key level to watch.
Bearish Scenario: A break below ₹725.02 (S1) could lead to further downside, with support at ₹709.59 (S4) potentially being tested.
Hello Guys ..
WhatsApp link- wa.link/d997q0
Email - techncialexpress@gmail.com ...
Script Coder/Trader//Investor from India. Drop a comment or DM if you have any questions! Let’s grow together!
WhatsApp link- wa.link/d997q0
Email - techncialexpress@gmail.com ...
Script Coder/Trader//Investor from India. Drop a comment or DM if you have any questions! Let’s grow together!
Related publications
Disclaimer
The information and publications are not meant to be, and do not constitute, financial, investment, trading, or other types of advice or recommendations supplied or endorsed by TradingView. Read more in the Terms of Use.