Titan - Trendline BO Post Q4 - Chart of the Week
TITAN
has a beautiful structure in the Weekly Timeframe and qualifies for my Chart of the Week idea post decent Q4 Results.
About:
TITAN
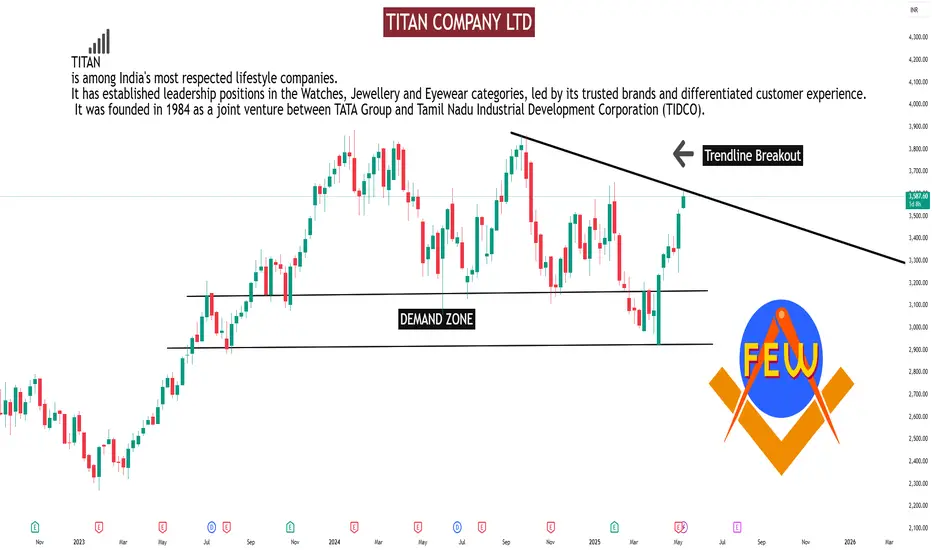
is among India's most respected lifestyle companies. It has established leadership positions in the Watches, Jewellery and Eyewear categories, led by its trusted brands and differentiated customer experience. It was founded in 1984 as a joint venture between TATA Group and Tamil Nadu Industrial Development Corporation (TIDCO).
Technical View:
The stock has decisively broken above a major descending trendline (marked with a white line) that had contained price action since July-August 2024. This trendline has been respected multiple times over approximately 8-9 months, making today's breakout particularly significant.
The breakout occurred with substantial price momentum, as indicated by the large green candle and 5%+ gain, suggesting conviction behind the move.
A critical demand zone (marked in green) around €2,900-3,000 that has repeatedly provided strong support. This zone has been tested and respected at least four times (marked with green arrows), demonstrating its importance as a major technical floor.
Since January 2025, the stock has formed progressively higher lows, indicating increasing buying interest at higher price levels.
Support and Resistance Analysis:
Key Resistance Levels
Immediate Resistance: ₹3,600 (horizontal level from previous swing highs)
Major Resistance: *3,886.95 (52-week high/all-time high)
Psychological Resistance: ₹3,750 (round number between current price and highs)
Key Support Levels
Immediate Support: ₹3,400-3,450 (previous resistance turned support) Trendline Support: ₹3,350 (the broken trendline should now act as support) Critical Support: *2,900-3,000 (major demand zone that has consistently held) Structural Support: €2,750 (low of the most recent significant pullback)
Trade Setup:
The combination of a clean trendline breakout, strong momentum, and historically reliable support zone suggests Titan Company may be poised for continued upside. Based on technical projections:
Target(Take Profit):
Near-term Target: 3,700-3,750 (measured move from the breakout point)
Intermediate Target: ₹3,886.95 (retest of previous high)
Longer-term Potential: New all-time highs above ₹3,900 if momentum continues
Stop Loss:
The critical factor to watch will be whether the stock can maintain positions above
the broken trendline on any pullbacks. This would confirm the validity of the
breakout and strengthen the bullish case. Conversely, a failure to hold above *3,400 could signal a false breakout scenario.
Disclaimer: "I am not SEBI REGISTERED RESEARCH ANALYST AND INVESTMENT ADVISER."
This analysis is intended solely for informational and educational purposes and should not be interpreted as financial advice. It is advisable to consult a qualified financial advisor or conduct thorough research before making investment decisions.
TITAN
has a beautiful structure in the Weekly Timeframe and qualifies for my Chart of the Week idea post decent Q4 Results.
About:
TITAN
is among India's most respected lifestyle companies. It has established leadership positions in the Watches, Jewellery and Eyewear categories, led by its trusted brands and differentiated customer experience. It was founded in 1984 as a joint venture between TATA Group and Tamil Nadu Industrial Development Corporation (TIDCO).
Technical View:
The stock has decisively broken above a major descending trendline (marked with a white line) that had contained price action since July-August 2024. This trendline has been respected multiple times over approximately 8-9 months, making today's breakout particularly significant.
The breakout occurred with substantial price momentum, as indicated by the large green candle and 5%+ gain, suggesting conviction behind the move.
A critical demand zone (marked in green) around €2,900-3,000 that has repeatedly provided strong support. This zone has been tested and respected at least four times (marked with green arrows), demonstrating its importance as a major technical floor.
Since January 2025, the stock has formed progressively higher lows, indicating increasing buying interest at higher price levels.
Support and Resistance Analysis:
Key Resistance Levels
Immediate Resistance: ₹3,600 (horizontal level from previous swing highs)
Major Resistance: *3,886.95 (52-week high/all-time high)
Psychological Resistance: ₹3,750 (round number between current price and highs)
Key Support Levels
Immediate Support: ₹3,400-3,450 (previous resistance turned support) Trendline Support: ₹3,350 (the broken trendline should now act as support) Critical Support: *2,900-3,000 (major demand zone that has consistently held) Structural Support: €2,750 (low of the most recent significant pullback)
Trade Setup:
The combination of a clean trendline breakout, strong momentum, and historically reliable support zone suggests Titan Company may be poised for continued upside. Based on technical projections:
Target(Take Profit):
Near-term Target: 3,700-3,750 (measured move from the breakout point)
Intermediate Target: ₹3,886.95 (retest of previous high)
Longer-term Potential: New all-time highs above ₹3,900 if momentum continues
Stop Loss:
The critical factor to watch will be whether the stock can maintain positions above
the broken trendline on any pullbacks. This would confirm the validity of the
breakout and strengthen the bullish case. Conversely, a failure to hold above *3,400 could signal a false breakout scenario.
Disclaimer: "I am not SEBI REGISTERED RESEARCH ANALYST AND INVESTMENT ADVISER."
This analysis is intended solely for informational and educational purposes and should not be interpreted as financial advice. It is advisable to consult a qualified financial advisor or conduct thorough research before making investment decisions.
Hello Guys ..
WhatsApp link- wa.link/d997q0
Email - techncialexpress@gmail.com ...
Script Coder/Trader//Investor from India. Drop a comment or DM if you have any questions! Let’s grow together!
WhatsApp link- wa.link/d997q0
Email - techncialexpress@gmail.com ...
Script Coder/Trader//Investor from India. Drop a comment or DM if you have any questions! Let’s grow together!
Related publications
Disclaimer
The information and publications are not meant to be, and do not constitute, financial, investment, trading, or other types of advice or recommendations supplied or endorsed by TradingView. Read more in the Terms of Use.