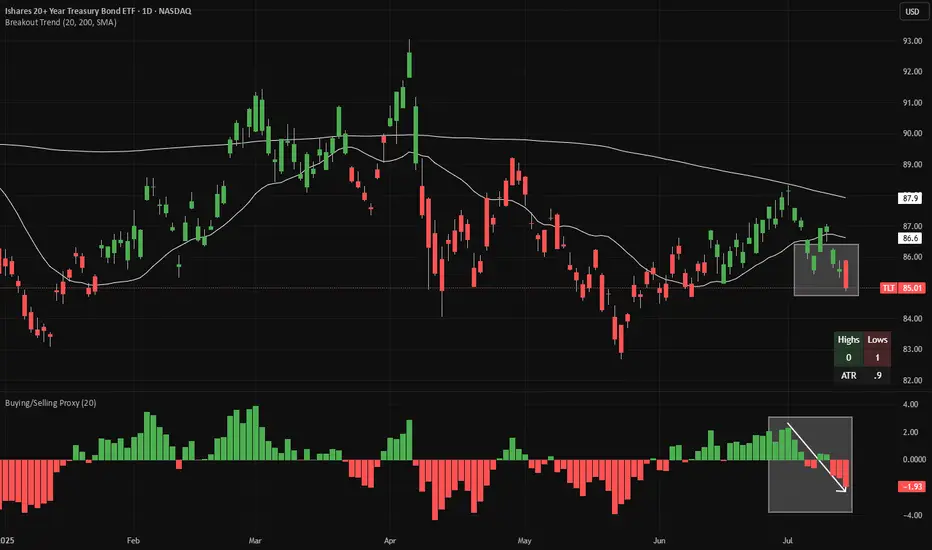
TLT is making 20-day lows (red candles in the main chart), while continuing to make 20-week lows on a weekly chart (not shown). Meanwhile, looking at a proxy of net buying/selling (bottom panel), we have flipped from buying to selling.
Looking at Japanese bond yields, 10-year JGBs (JP10Y) just broke out of tight range. This is the third attempt to trade above ~1.59% recently, which we saw earlier today. As Japan's is one of the world's leading overseas investors, this is an obvious warning sign for bonds globally.
There is good risk/reward to short bonds here, with a stop-loss if the price closes at a 20-day high. If a 20-day high is made, the candles will change color from red to green.
Both indicators (Breakout Trend and Buying/Selling Proxy) are available for free on TradingView.
Disclaimer
The information and publications are not meant to be, and do not constitute, financial, investment, trading, or other types of advice or recommendations supplied or endorsed by TradingView. Read more in the Terms of Use.
Disclaimer
The information and publications are not meant to be, and do not constitute, financial, investment, trading, or other types of advice or recommendations supplied or endorsed by TradingView. Read more in the Terms of Use.