As of May 21, 2025, Tamilnad Mercantile Bank Ltd. (NSE: TMB) is trading at ₹451.80, reflecting a 0.97% increase over the previous day.
📊 1-Day Support & Resistance Levels (Classic Pivot Method)
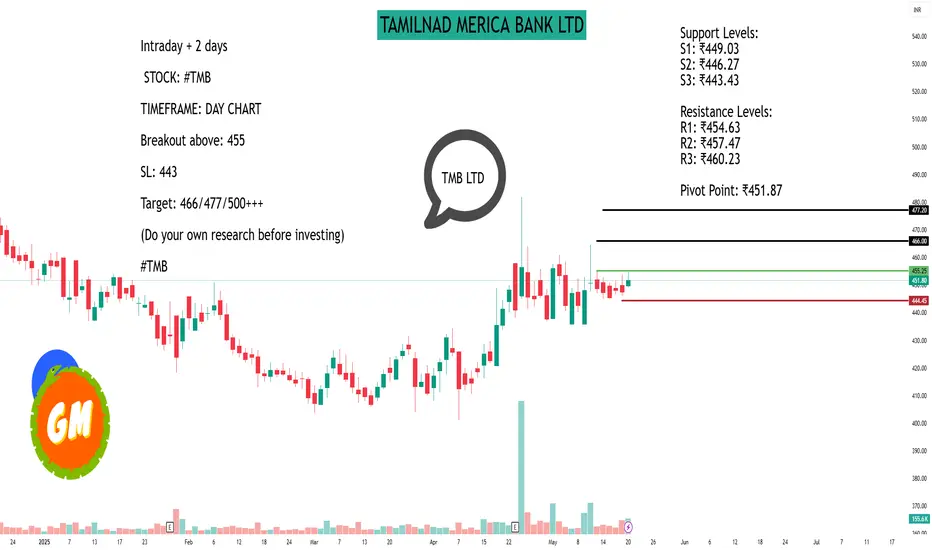
Based on the previous trading day's price range, the following support and resistance levels have been identified:
Support Levels:
S1: ₹449.03
S2: ₹446.27
S3: ₹443.43
Resistance Levels:
R1: ₹454.63
R2: ₹457.47
R3: ₹460.23
Pivot Point: ₹451.87
📈 Technical Indicators
Moving Averages:
20-day EMA: ₹444.47
50-day EMA: ₹437.38
100-day EMA: ₹438.24
200-day EMA: ₹446.85
Oscillators:
Relative Strength Index (RSI 14): 58.01 (indicates uptrend)
Commodity Channel Index (CCI 14): 62.68 (indicates uptrend)
Money Flow Index (MFI): 74.25 (indicates strong uptrend)
🔍 Trading Insights
The current price is slightly below the pivot point, suggesting a neutral to slightly bullish stance. If the price moves above the pivot point, it may test the resistance levels. Conversely, a drop below the pivot could lead to testing the support levels.
📊 1-Day Support & Resistance Levels (Classic Pivot Method)
Based on the previous trading day's price range, the following support and resistance levels have been identified:
Support Levels:
S1: ₹449.03
S2: ₹446.27
S3: ₹443.43
Resistance Levels:
R1: ₹454.63
R2: ₹457.47
R3: ₹460.23
Pivot Point: ₹451.87
📈 Technical Indicators
Moving Averages:
20-day EMA: ₹444.47
50-day EMA: ₹437.38
100-day EMA: ₹438.24
200-day EMA: ₹446.85
Oscillators:
Relative Strength Index (RSI 14): 58.01 (indicates uptrend)
Commodity Channel Index (CCI 14): 62.68 (indicates uptrend)
Money Flow Index (MFI): 74.25 (indicates strong uptrend)
🔍 Trading Insights
The current price is slightly below the pivot point, suggesting a neutral to slightly bullish stance. If the price moves above the pivot point, it may test the resistance levels. Conversely, a drop below the pivot could lead to testing the support levels.
Hello Guys ..
WhatsApp link- wa.link/d997q0
Email - techncialexpress@gmail.com ...
Script Coder/Trader//Investor from India. Drop a comment or DM if you have any questions! Let’s grow together!
WhatsApp link- wa.link/d997q0
Email - techncialexpress@gmail.com ...
Script Coder/Trader//Investor from India. Drop a comment or DM if you have any questions! Let’s grow together!
Related publications
Disclaimer
The information and publications are not meant to be, and do not constitute, financial, investment, trading, or other types of advice or recommendations supplied or endorsed by TradingView. Read more in the Terms of Use.