TON Coin – Breakout or Breakdown?
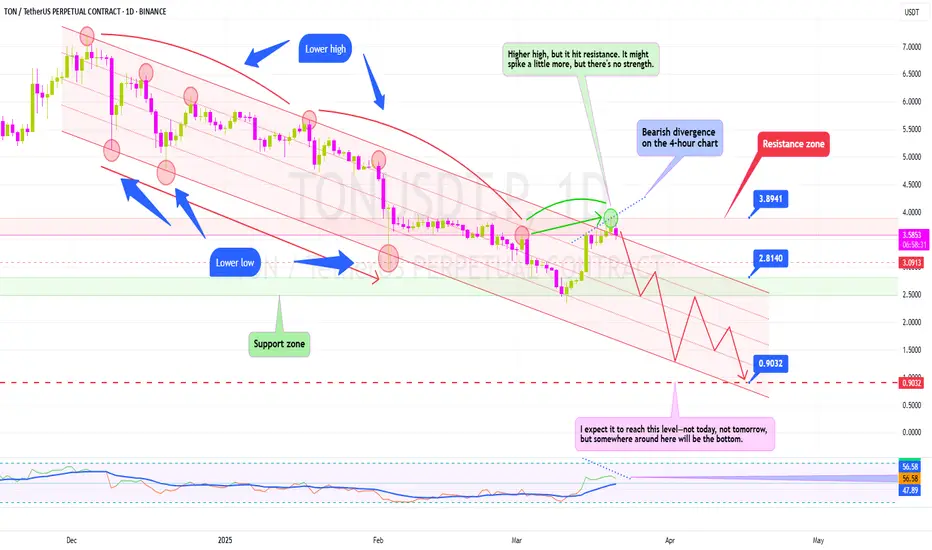
🔹 Currently moving in a downward channel.
📉 Lower highs & lower lows – a textbook bearish trend.
🚧 Right at a resistance zone.
Where could it go from here? Let's break it down!
TON’s Current Price Action
The chart clearly shows the downward channel—lower highs, lower lows, signaling trend weakness.
🎯 Right now, price is at resistance. From here, we either see a breakout or a rejection. (Spoiler: I’m leaning towards the latter.)
Why a Rejection Seems Likely
Price is at the top of the channel—if it doesn’t break out, it’s likely to return to the range.
The next key support sits around $2.80, making it a crucial level to watch.
Bearish RSI Divergence
On the 4H chart, RSI isn’t confirming the price action. Price is moving up, but RSI is trending down = classic bearish divergence.
This often signals trend weakness and a potential reversal.
Conclusion
⚠️ If price rejects at resistance, $0.90 is a key target. I expect it to reach this level—not today, not tomorrow, but somewhere around here will be the bottom.
The trend is still down—until we see a strong breakout, short setups remain favorable. If a breakout happens, time to reassess.
Are you bullish or bearish on TON? Drop your thoughts in the comments! 🔽
Magyar Discord Szerver -> Link Tagsághoz: whop.com/kriptoarenayt/
Disclaimer
The information and publications are not meant to be, and do not constitute, financial, investment, trading, or other types of advice or recommendations supplied or endorsed by TradingView. Read more in the Terms of Use.
Magyar Discord Szerver -> Link Tagsághoz: whop.com/kriptoarenayt/
Disclaimer
The information and publications are not meant to be, and do not constitute, financial, investment, trading, or other types of advice or recommendations supplied or endorsed by TradingView. Read more in the Terms of Use.
