Hello Friends, and welcome to Lesson #4. I will be going over Bollinger Bands today which is also a few of widely used indicators. I had also got some requests to do a lesson on Bollinger Bands, so here it is. Lets get straight to the point on this lesson.
We will be going over the below topics in this lesson:
What are Bollinger Bands?
How do we use the indicator?
* W Patterns
* M Patterns
* Some basic Stuff
These are some interesting topics about Bollinger Bands, so make sure you read and understand it very carefully, so you can apply these while trading.
WHAT ARE BOLLINGER BANDS?
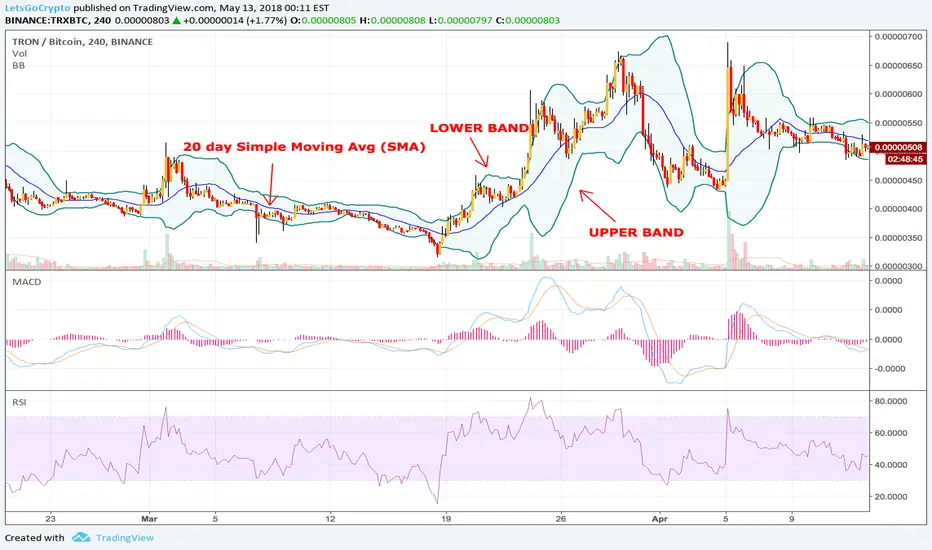
Refer to the above main chart for getting an understanding.
Basically, Bollinger bands are a volatility indicators. The upper and lower bands are around a Simple Moving Average (SMA) which for this tutorial we are using the default 20 day SMA. I usually use the default anyways when I use it for trading. So coming back to the definition, the distance between the upper and lower band tells us how much volatile a coin currently is. In simple terms, if the coin is not moving much, and is steady at a certain price, we call that a SQUEEZE, which means that at that time, the upper and lower bands will be tightly close together. Similarly, when a coin moves up or down suddenly, or has been going up or down for a while, the distance between the Upper and Lower Bands will be more depending upon the volatility. As you can see in the chart above, when TRX is steady at a certain price level, the bands are squeezed together, and as soon as the price starts going up, we see that the bands widen.
Got this part? Pretty Straightforward correct? Just to summarize that, when the coin is increasing in volatility, the bands widen, and when a coin is decreasing in volatility, they are narrow.
So this was basically an overview of the indicator, now note that some people do use Bollinger Bands alone as an indicator when trading , but I would recommend using MACD, and RSI along with it, so you can have more confirmations, and your trades can be successful. Also, the more longer the timeframe, you will see more accuracy in this indicator. But that doesn't mean you can't use them on shorter time frames.
Now you must be thinking, when is the interesting part going to start of how to actually use these in trading? What are some of the signals to look for? Lets get to that right away.
HOW DO WE USE THE INDICATOR:
Keep this in mind, that the upper bands and the lower bands, both act as a support to the price action, and the 20 day SMA which I like to call the Center Band, also acts as a stronger support/resistance. This can be clearly seen on the chart above.
Now we will talk about the W pattern and the M - Pattern. This might be confusing for some of you, but now do not just rely on the Bollinger bands with these patterns. Make sure you have another indicator confirmation. Bollinger Bands is not meant to be used by itself as an indicator.
Continue reading below......
We will be going over the below topics in this lesson:
What are Bollinger Bands?
How do we use the indicator?
* W Patterns
* M Patterns
* Some basic Stuff
These are some interesting topics about Bollinger Bands, so make sure you read and understand it very carefully, so you can apply these while trading.
WHAT ARE BOLLINGER BANDS?
Refer to the above main chart for getting an understanding.
Basically, Bollinger bands are a volatility indicators. The upper and lower bands are around a Simple Moving Average (SMA) which for this tutorial we are using the default 20 day SMA. I usually use the default anyways when I use it for trading. So coming back to the definition, the distance between the upper and lower band tells us how much volatile a coin currently is. In simple terms, if the coin is not moving much, and is steady at a certain price, we call that a SQUEEZE, which means that at that time, the upper and lower bands will be tightly close together. Similarly, when a coin moves up or down suddenly, or has been going up or down for a while, the distance between the Upper and Lower Bands will be more depending upon the volatility. As you can see in the chart above, when TRX is steady at a certain price level, the bands are squeezed together, and as soon as the price starts going up, we see that the bands widen.
Got this part? Pretty Straightforward correct? Just to summarize that, when the coin is increasing in volatility, the bands widen, and when a coin is decreasing in volatility, they are narrow.
So this was basically an overview of the indicator, now note that some people do use Bollinger Bands alone as an indicator when trading , but I would recommend using MACD, and RSI along with it, so you can have more confirmations, and your trades can be successful. Also, the more longer the timeframe, you will see more accuracy in this indicator. But that doesn't mean you can't use them on shorter time frames.
Now you must be thinking, when is the interesting part going to start of how to actually use these in trading? What are some of the signals to look for? Lets get to that right away.
HOW DO WE USE THE INDICATOR:
Keep this in mind, that the upper bands and the lower bands, both act as a support to the price action, and the 20 day SMA which I like to call the Center Band, also acts as a stronger support/resistance. This can be clearly seen on the chart above.
Now we will talk about the W pattern and the M - Pattern. This might be confusing for some of you, but now do not just rely on the Bollinger bands with these patterns. Make sure you have another indicator confirmation. Bollinger Bands is not meant to be used by itself as an indicator.
Continue reading below......
Note
* W - Patterns (Bullish): W patterns are formed when a a coin has been in a downtrend and it forms a first reaction low at the lower bands, and in most of the cases closes outside the bands. Then the price goes up and touches the center band, and forms another LOWER LOW, in this case mostly closing inside the Lower Band.
See the below image to get a better understanding:
In the chart above you can see how the BTC price forms a reaction low, touches the center bands, and then makes another lower low. Now when it starts moving up, you can buy if other indicators give a confirmation, or you can wait for a breakout to happen. A breakout in this case is the red line that I have drawn, which basically is the price where it touched the center band. Notice how the price moves up after the breakout, and then it retests the center band again, before moving more up.
Lets Summarize:
1. Price forms a reaction low. (Mostly closes outside the lower bollinger band)
2. Price bounces to touch the center band.
3. Price forms a lower low and closes inside the bollinger band.
4. Price starts moving upwards and breaks the resistance.
I hope you are understanding this very well, if not please do message me on the telegram group mentioned below in my signature. I am always there to help.
This was the W - Pattern, lets call it the bullish pattern. Now we will look at a similar but opposite pattern which is the M - Pattern.
Continue reading below....
Note
* M - Pattern (Bearish):Similarly and opposite to W patterns, M patterns are formed when a coin has been in an uptrend and it forms a reaction high, after which the price is pulled back to touch the middle band. Now this is an important part so read it carefully. Once it touches the middle line, the price makes a higher high, but fails in touching the upper Bollinger band. This is a bearish sign, and we should also confirm with other indicators such as MACD and RSI when this happens. Once it fails touching the upper band the price will probably move down and break the support.
Lets take a look at an example:
Notice how a price is in an uptrend, and forms a reaction high, then it pulls back and touches the middle band. Now we see a bounce from the middle band, and we form another reaction high. Not in every case we will see a higher high. M patters can sometimes be complicated, and the reaction high can be higher or lower than the next reaction high it makes. See very carefully that the in the chart above the higher high (second reaction high) it makes doesn’t touch the upper band. We then see a price pull back and then it breaks the support. Down it goes then. Its as simple as that.
Lets summarize:
1. Price is in an uptrend and forms a reaction high.
2. Price pulls back and touches the middle band.
3. Price bounces to form another reaction high, but if it doesn’t touch the upper band, then we have a strong bearish signal.
4. Price then heads down from that point and breaks the support.
Note: W - Patterns can sometime as be considered as double bottom, and similarly M - Patterns can sometimes be considered as double top. I will have a separate lesson on patterns later.
So this was a short and straight to the point explanation on the W and M patterns that people use to trade using Bollinger Bands.
Bollinger bands can sometimes get confusing, which is why I recommend using other indicators along with it, so you can get a strong confirmation.
Now lets go over some basic stuff about Bollinger Bands. Stuff, that you need to keep in mind while using this indicator.
Continue reading below.....
Note
SOME BASIC STUFF:Get one thing very clear, when you see a candle touching the upper band or below band, it is not a signal to buy or sell. Do not consider that as a signal. Many people often make that mistake. You don’t.
Of course when the price moves up and touches the upper bands, it shows strength, and same when a price moves lower to touch the lower band, it shows weakness. When you see the first candle touching the upper band, that doesn’t mean it will start going down. We may see the following few candles even higher and crossing the upper band.
If you see a W - Pattern being formed, and after breaking the resistance, it touches the uptrend, that means it is just the start of an uptrend. Similarly when you see M - Patter being formed, and the price breaks the support and touches the lower band, that can be considered as the beginning of a downtrend.
It is very crucial that when in a downtrend, you see the candle closing below the lower band, it is again a bearish signal, and that just means that the coin is still weak to start an uptrend. Similarly, when a candle closes above the upper band, it means it is strong to keep going up.
Although this indicator is really important to use it when doing your analysis for entering a trade, it shouldn’t be used alone for trading. I really recommend using MACD and RSI along with it for a stronger confirmation.
I hope you followed what I said, and read everything very carefully. This is very simple to understand. Make sure you get this, and practice trading with this method with small amounts first, and once you get the hang of it, go out big.
If you have any questions, feel free to message me here, or on telegram group mentioned below in my signature. Most importantly, follow me here and join the channel or group below so you can get the latest updates on charts, and lessons. Also, its always amazing to interact with our great community and talk crypto.
This is just the beginning of the Lesson friends. I have many more to come. So stay tuned for more. Lots of knowledge to share.
Happy Trading!
Note
NOTE: I just noticed I made a mistake on the chart. The labels Upper Band and Lower Band are wrong. But I am sure you can figure that out :).Disclaimer
The information and publications are not meant to be, and do not constitute, financial, investment, trading, or other types of advice or recommendations supplied or endorsed by TradingView. Read more in the Terms of Use.
Disclaimer
The information and publications are not meant to be, and do not constitute, financial, investment, trading, or other types of advice or recommendations supplied or endorsed by TradingView. Read more in the Terms of Use.