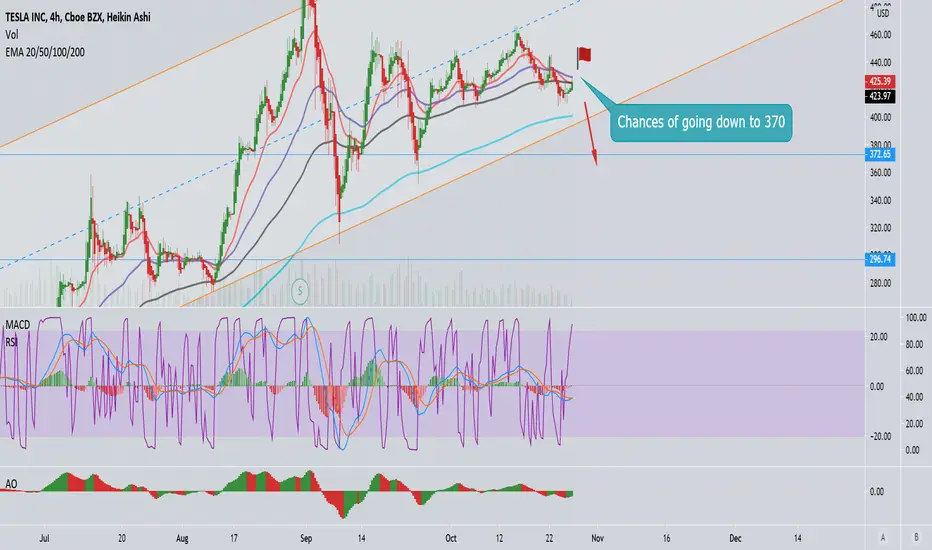
On the weekly chart the MACD signals Sell. Though lower timeframes signals there will a spike ( 20 day MA may cross over other MA's) , if it goes down below the shown parallel channel then there is a possibility of 370.
1. RSI(2) used , 90 & 10 upper and lower level respectively
2. Bollinger band used , On weekly chart the gap between upper and lower band is huge. however in lower timeframe there is a squeeze.
3. Fib levels are used to determined
4. support and resistance are marked using higher timeframe and validated with lower timeframe.
Thanks
Joyson
Disclaimer
The information and publications are not meant to be, and do not constitute, financial, investment, trading, or other types of advice or recommendations supplied or endorsed by TradingView. Read more in the Terms of Use.
Disclaimer
The information and publications are not meant to be, and do not constitute, financial, investment, trading, or other types of advice or recommendations supplied or endorsed by TradingView. Read more in the Terms of Use.