1-Hour Chart Analysis (Trading Perspective)
Key Observations:
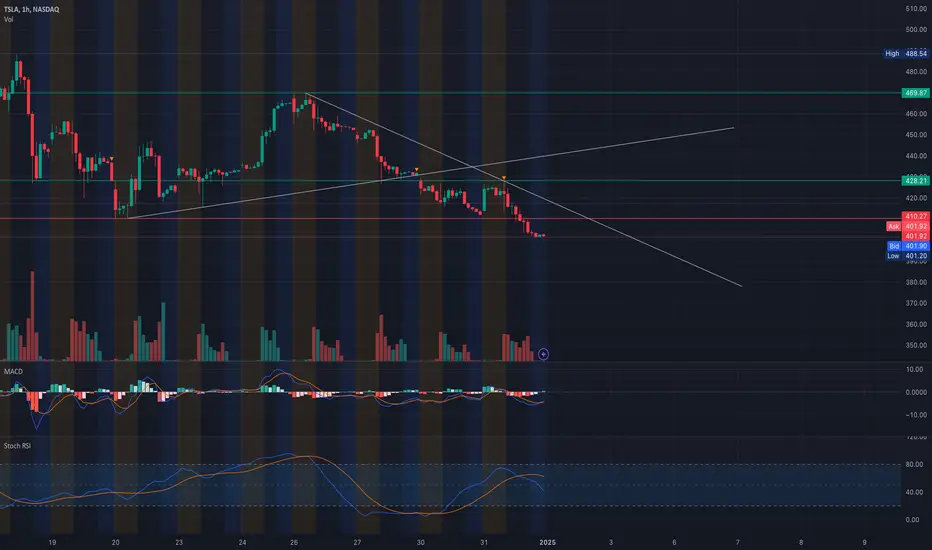
1. Price Action:
* TSLA is in a short-term downtrend, with the price respecting the downward-sloping trendline.
* A key support zone is around $401–$403, which aligns with recent consolidation levels.
2. Indicators:
* MACD: The MACD is bearish, with the signal line crossing below the MACD line and histogram bars increasing in the negative zone, indicating downward momentum.
* Stoch RSI: The Stoch RSI is near the oversold zone, which might suggest a potential bounce if supported by price action.
3. Volume:
* Volume has picked up during the recent bearish candles, confirming seller strength in the short term.
Trading Strategy:
Bearish Continuation:
* Entry: If the price breaks below the key support at $401 with increasing volume, enter a short position.
* Stop Loss: Place the stop above the previous swing high or near the downward-sloping trendline (~$410).
* Targets:
* Target 1: $395
* Target 2: $390 (psychological level and historical support).
Reversal Opportunity:
* Entry: If the price holds above $401 and forms a bullish reversal candle with confirmation from MACD flattening and Stoch RSI crossing upwards.
* Stop Loss: Place the stop just below the support level at $399.
* Targets:
* Target 1: $410 (trendline resistance).
* Target 2: $420 (major resistance and upper channel boundary).
Daily Chart Analysis (Options Perspective with GEX)

Key Observations:
1. Gamma Exposure (GEX):
* Key Levels:
* Call Wall at $455: This is a significant resistance level, indicating where call sellers might exert pressure.
* Put Wall at $380: Major support level where put buyers may defend.
* HVL (Highest Volume Level): At $403, aligning with support on the 1-hour chart, making it a critical decision level.
2. Options Oscillator (IV and GEX):
* IV Rank (IVR) is high at 73.1, indicating elevated implied volatility, which could favor premium-selling strategies for options traders.
* Net Gamma is negative, suggesting that the market is leaning bearish in the short term.
Options Strategy:
Bearish Strategy:
* Entry: If TSLA breaks below $401 (HVL) with momentum.
* Option Play: Buy $395 strike puts expiring in 1–2 weeks for short-term bearish exposure.
* Targets:
* First target: $390 (Put Wall).
* Second target: $380 (next major support).
* Stop Loss: Exit the puts if TSLA reclaims $405 and holds above this level.
Bullish Strategy:
* Entry: If TSLA bounces off the $401 support and breaks above $410 with confirmation.
* Option Play: Sell $380 strike puts or buy $420 strike calls expiring in 2–4 weeks.
* Targets:
* First target: $420 (resistance level).
* Second target: $455 (Call Wall).
* Stop Loss: Exit if TSLA breaks below $399.
Conclusion
* For trading, watch the $401–$403 support level for either a breakdown (short entry) or a reversal (long entry).
* For options, leverage the Gamma levels by playing the Call Wall at $455 and Put Wall at $380 as key targets.
* Always monitor volume and indicator confirmation to ensure alignment with the setup. Use disciplined stop-loss and risk management for all trades.
Disclaimer
This analysis is for educational and informational purposes only and should not be considered as financial or investment advice.
Key Observations:
1. Price Action:
* TSLA is in a short-term downtrend, with the price respecting the downward-sloping trendline.
* A key support zone is around $401–$403, which aligns with recent consolidation levels.
2. Indicators:
* MACD: The MACD is bearish, with the signal line crossing below the MACD line and histogram bars increasing in the negative zone, indicating downward momentum.
* Stoch RSI: The Stoch RSI is near the oversold zone, which might suggest a potential bounce if supported by price action.
3. Volume:
* Volume has picked up during the recent bearish candles, confirming seller strength in the short term.
Trading Strategy:
Bearish Continuation:
* Entry: If the price breaks below the key support at $401 with increasing volume, enter a short position.
* Stop Loss: Place the stop above the previous swing high or near the downward-sloping trendline (~$410).
* Targets:
* Target 1: $395
* Target 2: $390 (psychological level and historical support).
Reversal Opportunity:
* Entry: If the price holds above $401 and forms a bullish reversal candle with confirmation from MACD flattening and Stoch RSI crossing upwards.
* Stop Loss: Place the stop just below the support level at $399.
* Targets:
* Target 1: $410 (trendline resistance).
* Target 2: $420 (major resistance and upper channel boundary).
Daily Chart Analysis (Options Perspective with GEX)
Key Observations:
1. Gamma Exposure (GEX):
* Key Levels:
* Call Wall at $455: This is a significant resistance level, indicating where call sellers might exert pressure.
* Put Wall at $380: Major support level where put buyers may defend.
* HVL (Highest Volume Level): At $403, aligning with support on the 1-hour chart, making it a critical decision level.
2. Options Oscillator (IV and GEX):
* IV Rank (IVR) is high at 73.1, indicating elevated implied volatility, which could favor premium-selling strategies for options traders.
* Net Gamma is negative, suggesting that the market is leaning bearish in the short term.
Options Strategy:
Bearish Strategy:
* Entry: If TSLA breaks below $401 (HVL) with momentum.
* Option Play: Buy $395 strike puts expiring in 1–2 weeks for short-term bearish exposure.
* Targets:
* First target: $390 (Put Wall).
* Second target: $380 (next major support).
* Stop Loss: Exit the puts if TSLA reclaims $405 and holds above this level.
Bullish Strategy:
* Entry: If TSLA bounces off the $401 support and breaks above $410 with confirmation.
* Option Play: Sell $380 strike puts or buy $420 strike calls expiring in 2–4 weeks.
* Targets:
* First target: $420 (resistance level).
* Second target: $455 (Call Wall).
* Stop Loss: Exit if TSLA breaks below $399.
Conclusion
* For trading, watch the $401–$403 support level for either a breakdown (short entry) or a reversal (long entry).
* For options, leverage the Gamma levels by playing the Call Wall at $455 and Put Wall at $380 as key targets.
* Always monitor volume and indicator confirmation to ensure alignment with the setup. Use disciplined stop-loss and risk management for all trades.
Disclaimer
This analysis is for educational and informational purposes only and should not be considered as financial or investment advice.
Disclaimer
The information and publications are not meant to be, and do not constitute, financial, investment, trading, or other types of advice or recommendations supplied or endorsed by TradingView. Read more in the Terms of Use.
Disclaimer
The information and publications are not meant to be, and do not constitute, financial, investment, trading, or other types of advice or recommendations supplied or endorsed by TradingView. Read more in the Terms of Use.