Technicals:
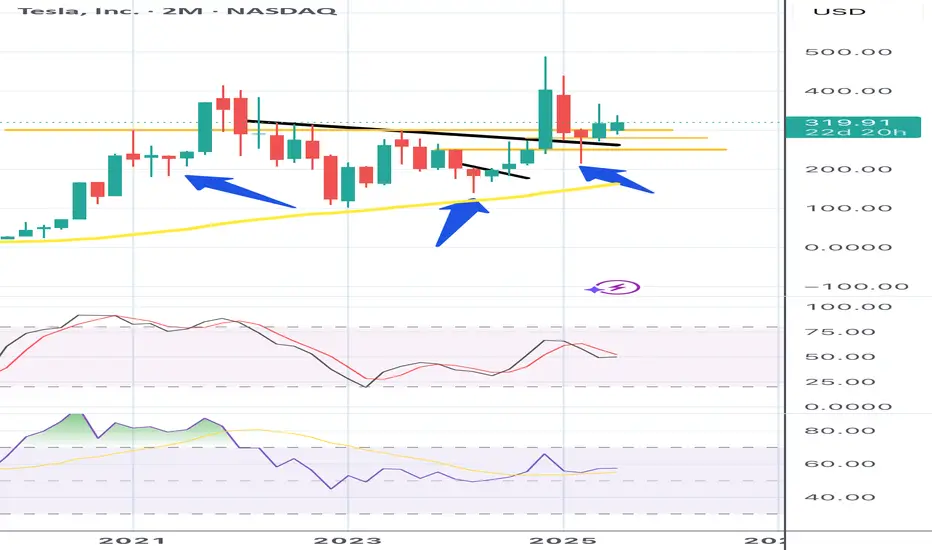
Big Picture: Huge wedge breakout, followed by retest and bounce, and now we are flagging.
2Month Chart: Every time TSLA has had a hammer candle on the 2M chart, we have rallied hard within 2-7 months.
100 SMA on the daily: Everytime TSLA’s daily 100 SMA has gone from an extended downslope to upsloping (with the addition of some wedge breakout or Inverted H&S), it’s been the beginning of a rally.
Fundamentals: While this analysis is primarily technical, Tesla’s long-term prospects, its strong base of loyal investors, and the high level of short interest believing its already over priced- suggests to me that the technicals are signaling a huge run this year to $450-$500+.
Disclaimer
The information and publications are not meant to be, and do not constitute, financial, investment, trading, or other types of advice or recommendations supplied or endorsed by TradingView. Read more in the Terms of Use.
Disclaimer
The information and publications are not meant to be, and do not constitute, financial, investment, trading, or other types of advice or recommendations supplied or endorsed by TradingView. Read more in the Terms of Use.