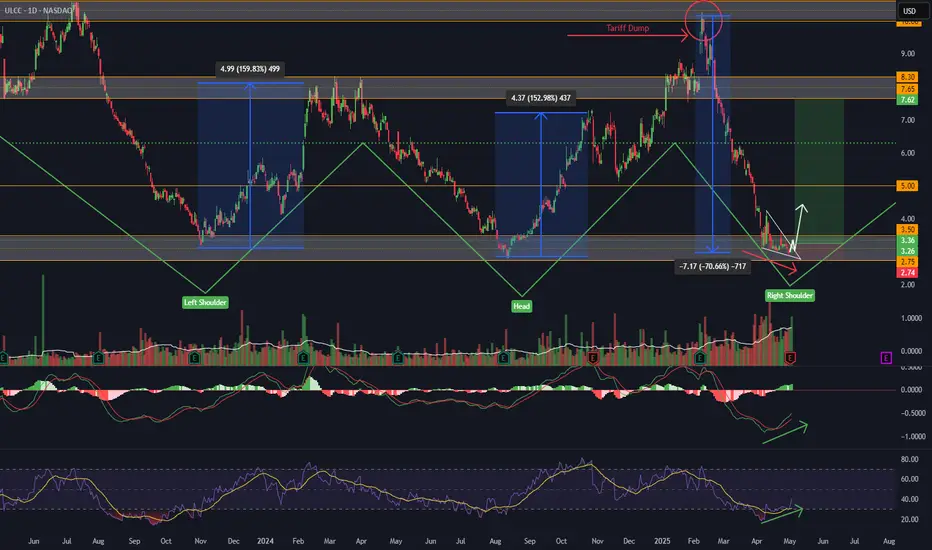
Frontier Airlines (ULCC) reported earnings this week and missed expectations, but their price remained stable post-earnings announcement and closed the week strong today. This was surprising considering how relatively weak they have been following the Tariff news in February. The chart has caught my attention for a long swing for a few reasons.
1.) There is a perfect Inverse Head & Shoulders pattern on the daily/weekly timeframe that is being respected.
2.) There's a daily falling wedge into the right shoulder of this inverse H&S setup that has broken out on high volume.
3.) There is bullish divergence on the daily timeframe as price made new lows while the MACD and RSI are BOTH curling up.
4.) RSI broke below 30-20 range, which indicates price is extremely oversold (last 2 times this occurred, the stock rose 150%+)
5.) This selloff was driven by the thesis that tariffs would squeeze consumer spending - and Frontier's entire business model, "Low Fares Done Right," markets towards people who want to spend less on flights. In other words, the airline industry is highly impacted by economic conditions, and now that we are seeing a change in the tariff narrative, it's very possible we could see a nice pop in this stock as a relief bounce is put in and/or short sellers cover now that price has dropped 70% since Feb 2025.
What are the risks? A full blown recession/high inflation/war/etc lol. But the technicals aren't showing that. It concerns me (slightly) that the broader market (including other airlines) has bounced nicely while Frontier has consolidated. However, the fact that the price didn't continue selling off into new all time lows following the earnings miss could be a sign that the move is exhausted and needs a bounce.
The high time frame reversal pattern is being confirmed with a variety of other indicators and the more recent falling wedge breakout on high volume with bullish divergence. This is a high confluence long setup with great risk to reward potential for an equity position.
(Not Financial Advice)
Disclaimer
The information and publications are not meant to be, and do not constitute, financial, investment, trading, or other types of advice or recommendations supplied or endorsed by TradingView. Read more in the Terms of Use.
Disclaimer
The information and publications are not meant to be, and do not constitute, financial, investment, trading, or other types of advice or recommendations supplied or endorsed by TradingView. Read more in the Terms of Use.
