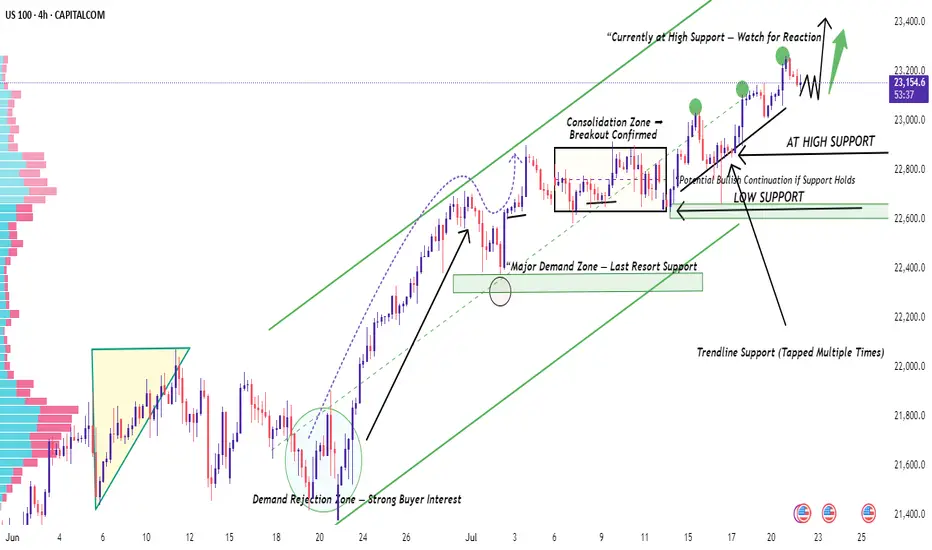
The US100 is currently respecting a well-defined ascending channel on the 4H timeframe. Price action has consistently bounced off both the low and high support zones marked within the structure.
After a period of consolidation (yellow box), price broke out and is now testing the high support zone, which aligns with a prior resistance flip. This zone has been respected multiple times, as shown by the green arrows marking higher lows.
📍 Key Levels:
High Support Zone: ~23,100 (acting as immediate support)
Low Support Zone: ~22,600
Resistance Area: Near upper trendline ~23,400
💡 Trade Idea: As long as price holds above the high support, we may see a bullish continuation toward the top of the channel. A deeper correction could find support at the lower green zone, which has previously acted as a strong demand area.
⚠️ This is a technical analysis idea — not financial advice. Always use proper risk management and confirm with your own strategy.
Note
The chart US100 has respected key levels impressively—price broke out of the consolidation zone, bounced perfectly from the major demand area, and is now trading near the top of the ascending channel around 23,248, just shy of the 23,300–23,400 target zone. Most short-term targets have been hit or are nearly achieved. Strong support at 22,800 held firmly, confirming bullish structure. As long as price stays above this zone, the trend remains intact. A breakout above 23,400 could trigger momentum, while dips toward 22,800–22,400 may offer high-probability buy setups.Note
The chart US100 has respected key levels impressively—price broke out of the consolidation zone, bounced perfectly from the major demand area, and is now trading near the top of the ascending channel around 23,248, just shy of the 23,300–23,400 target zone. Most short-term targets have been hit or are nearly achieved. Strong support at 22,800 held firmly, confirming bullish structure. As long as price stays above this zone, the trend remains intact. A breakout above 23,400 could trigger momentum, while dips toward 22,800–22,400 may offer high-probability buy setups.Trade closed: target reached
Target has been achieved successfully. Wait for our next signals which will be given after the proper analysis.Note
Update: 🎯 US100 (Nasdaq‑100) has successfully reached our target zone from 23,000 to 23,400, marking a powerful bullish continuation. This move followed a classic breakout and retest structure, with a brief liquidity grab below support before momentum surged. Backed by strong technical confluence—including bullish RSI, MACD, and moving averages across timeframes—plus ongoing strength from major tech and AI-driven earnings, the index hit fresh highs. This confirms our bullish bias and validates the structure-based setup. We'll now watch for continuation above 23,400 or potential re-entry on a healthy pullback.📈 Robert FX Assets | Verified Forex Analyst
📊 Smart Signals | XAUUSD | Risk Management
📬 Join Free Channel: t.me/RobertFXAssets
📊 Smart Signals | XAUUSD | Risk Management
📬 Join Free Channel: t.me/RobertFXAssets
Related publications
Disclaimer
The information and publications are not meant to be, and do not constitute, financial, investment, trading, or other types of advice or recommendations supplied or endorsed by TradingView. Read more in the Terms of Use.
📈 Robert FX Assets | Verified Forex Analyst
📊 Smart Signals | XAUUSD | Risk Management
📬 Join Free Channel: t.me/RobertFXAssets
📊 Smart Signals | XAUUSD | Risk Management
📬 Join Free Channel: t.me/RobertFXAssets
Related publications
Disclaimer
The information and publications are not meant to be, and do not constitute, financial, investment, trading, or other types of advice or recommendations supplied or endorsed by TradingView. Read more in the Terms of Use.