I cleaned the chart a bit for readability.
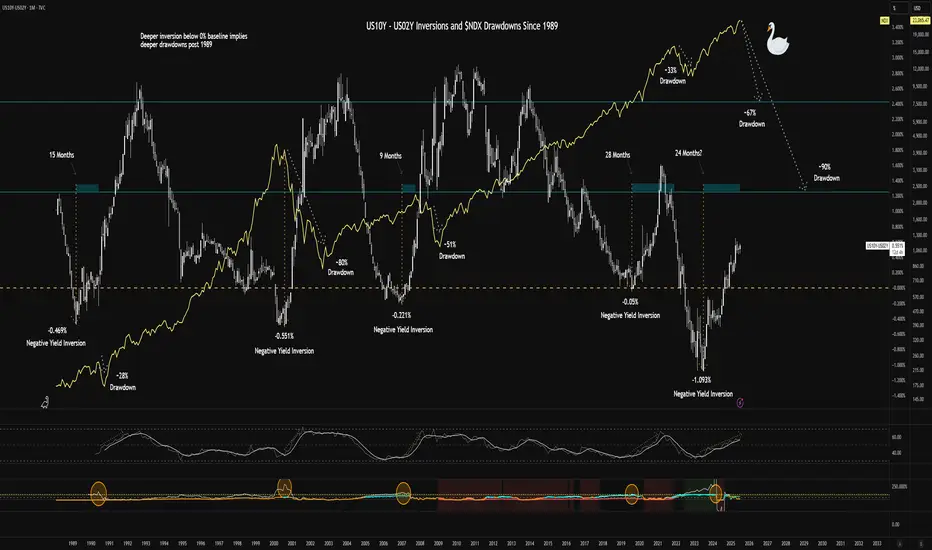
The chart shows historical inversions in the US10Y and US02Y and the drawdowns in the
  NDX that followed. The implication is that we should expect to see a >50% drawdown within 4 months. I'm not calling the "why" but only drawing parallels to historical price action following bond market environments.
My current interpretation is that we're headed for stagflation - interest rates will be stickier than consensus takes driven by market uncertainty and increasing energy prices. The Trump administration seems to be pushing for policies that would alleviate pain from stagflation. The next revolution in technology promises massive productivity gains with respect to efficiencies in money transfers and back-end business operations in general. Unemployment will continue to rise as automation begins to increase.
The market will take time to find its bearings (upskilling and learning curves for employees and employers).
The Ai boom requires energy - more than we currently have capacity for. Companies will have to finance this build-out with vast sums of money. The reward will take time to harvest. Pain in the real economy will dampen consumption for a while.
Price action in Ai and technology companies has outpaced realized gains - we are at the front-end of this curve, much like the dotcom bubble.
Speculative bubbles like BTCUSD represent a direct threat to control over monetary policy for the reserve currency and hegemony. I am still very long USA (Dollar Milkshake). BTC has real value for struggling economies eclipsed by the majors, but for holders of this asset in the western world, large gains in BTC would necessarily depend on the collapse of civilization as we know it, implying a logical paradox for people that expect outsized returns. BTC.D demonstrates the loss of share of market cap well.
I invite comments with legitimate rational criticism as I'm always looking to improve my thinking about this topic.
Long ideas (comment additional tickers):
Short ideas:
I am employing long-expiry, OTM verticals to improve costs of trades or synthetic longs on moonshot names if not holding shares outright.
Share your comments. Good luck to all!
The chart shows historical inversions in the
My current interpretation is that we're headed for stagflation - interest rates will be stickier than consensus takes driven by market uncertainty and increasing energy prices. The Trump administration seems to be pushing for policies that would alleviate pain from stagflation. The next revolution in technology promises massive productivity gains with respect to efficiencies in money transfers and back-end business operations in general. Unemployment will continue to rise as automation begins to increase.
The market will take time to find its bearings (upskilling and learning curves for employees and employers).
The Ai boom requires energy - more than we currently have capacity for. Companies will have to finance this build-out with vast sums of money. The reward will take time to harvest. Pain in the real economy will dampen consumption for a while.
Price action in Ai and technology companies has outpaced realized gains - we are at the front-end of this curve, much like the dotcom bubble.
Speculative bubbles like
I invite comments with legitimate rational criticism as I'm always looking to improve my thinking about this topic.
Long ideas (comment additional tickers):
- Utility-driven tokens enabling this new paradigm -
 XRPUSD
 XLMUSD
 ICPUSD
 LINKUSD
 XDCUSD
 HBARUSD etc.
 - Inelastic staples -
 LLY
LLY BUD
BUD PM
PM - Energy and Ai infra -
 ABAT
ABAT WWR
WWR ENVX
ENVX PLUG
PLUG LAC
LAC LEU
LEU SMR
SMR CHPT
CHPT KMI
KMI QS
QS ITRI
ITRI ENPH
ENPH FSLR
FSLR CLSK
CLSK TSLA
TSLA EWTUSD
 - Disruption Beneficiaries -
 WU
WU UPW
UPW OPEN
OPEN PYPL
PYPL FIS
FIS XYZ
XYZ FIVN
FIVN BGM
BGM
Short ideas:
I am employing long-expiry, OTM verticals to improve costs of trades or synthetic longs on moonshot names if not holding shares outright.
Share your comments. Good luck to all!
Disclaimer
The information and publications are not meant to be, and do not constitute, financial, investment, trading, or other types of advice or recommendations supplied or endorsed by TradingView. Read more in the Terms of Use.
Disclaimer
The information and publications are not meant to be, and do not constitute, financial, investment, trading, or other types of advice or recommendations supplied or endorsed by TradingView. Read more in the Terms of Use.