US30 Breakout from Symmetrical Triangle – Bullish Targets Eyed
US30 (Dow Jones) has successfully broken out of a symmetrical triangle consolidation pattern, signaling a shift toward bullish momentum. The breakout is occurring after a strong recovery from April lows, with higher lows supporting upward price pressure.
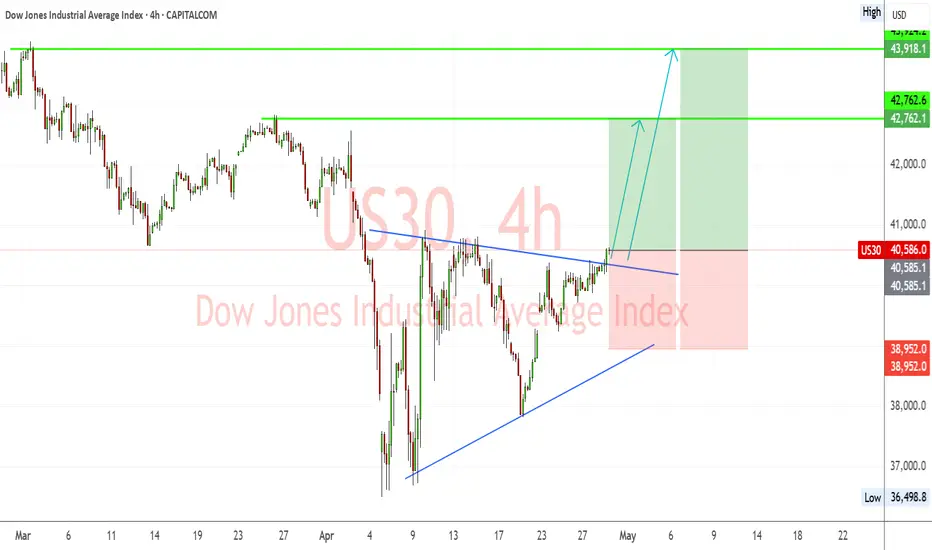
🔹 Chart Structure:
Symmetrical triangle with a clean breakout above descending resistance.
Series of higher lows indicating accumulation.
Bullish breakout confirmed with price pushing above the 40,580 zone.
🔑 Key Levels:
Current Price: 40,586
Breakout Confirmation Level: 40,580
Immediate Resistance/TP1: 42,762
Major Resistance/TP2: 43,924
Support Zone: 38,950
Invalidation/Stop Level: Below 38,950
✅ Bullish Confluence Factors:
Breakout of symmetrical triangle pattern
Higher lows indicate bullish strength and accumulation
Momentum shift visible on lower timeframes
Positive correlation with improving US equity market sentiment
Anticipation of dovish Fed tone could boost equities
🧠 Fundamental Context:
Market is cautiously optimistic ahead of FOMC this week; dovish stance expected due to recent soft economic indicators.
Earnings season tailwinds and lower bond yields support index gains.
Ongoing political and tariff-related headlines may cause volatility, but technical breakout remains in focus.
💡 Trade Idea:
Bias: Bullish
Entry: On successful retest of 40,580 or continuation above 40,600
TP1: 42,762
TP2: 43,924
Stop Loss: Below 38,950
📌 Note: Watch for pullbacks to triangle resistance-turned-support. FOMC and US macro data releases midweek can impact momentum.
Trade closed manually
US30 +186 PIPS CLOSED. 📈Forex Telegram Alerts
🥇95% Accurate Signals
♻️1-2 Daily Signals
✔️Free Daily Profitable Signals
⤵️‼️Join us on Telegram‼️⤵️
📱Telegram:➡️ t.me/ultreos_forex
Get VIP - ultreosforex.com/
🥇95% Accurate Signals
♻️1-2 Daily Signals
✔️Free Daily Profitable Signals
⤵️‼️Join us on Telegram‼️⤵️
📱Telegram:➡️ t.me/ultreos_forex
Get VIP - ultreosforex.com/
Disclaimer
The information and publications are not meant to be, and do not constitute, financial, investment, trading, or other types of advice or recommendations supplied or endorsed by TradingView. Read more in the Terms of Use.
📈Forex Telegram Alerts
🥇95% Accurate Signals
♻️1-2 Daily Signals
✔️Free Daily Profitable Signals
⤵️‼️Join us on Telegram‼️⤵️
📱Telegram:➡️ t.me/ultreos_forex
Get VIP - ultreosforex.com/
🥇95% Accurate Signals
♻️1-2 Daily Signals
✔️Free Daily Profitable Signals
⤵️‼️Join us on Telegram‼️⤵️
📱Telegram:➡️ t.me/ultreos_forex
Get VIP - ultreosforex.com/
Disclaimer
The information and publications are not meant to be, and do not constitute, financial, investment, trading, or other types of advice or recommendations supplied or endorsed by TradingView. Read more in the Terms of Use.