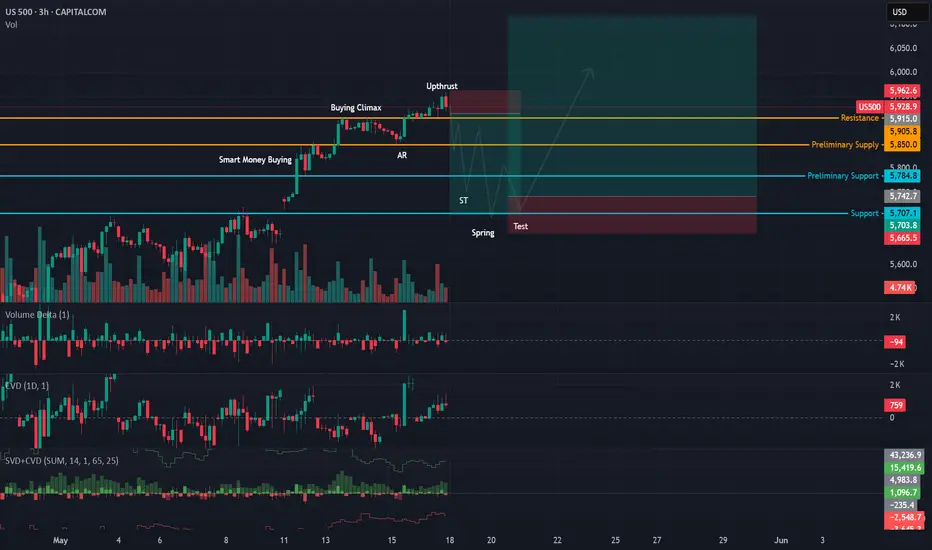
The US500 appears to be working through a classic Wyckoff reaccumulation phase following a strong rally during price mark-up. After a swift move upward, price formed what looks like a Buying Climax, followed by an Automatic Reaction (AR) and now an Upthrust at the recent highs.
So far, volume and delta behavior are aligning well with this. During the upthrust, we saw increased volume, but delta turned negative, indicating selling pressure into strength. This was also accompanied by a CVD divergence, showing that although price pushed to new highs, the underlying buying wasn't supporting the move just yet. That often hints distribution by strong hands as late buyers step, likely fuel by the good ol' Trump Pump.
With that in mind, a pullback into the lower range is expected to create the Secondary Test (ST). This could lead to a possible Spring, a shakeout below recent support (around the 5700–5720 zone) meant to trap sellers. Ideally, this would be followed by a Test, where price returns to the Spring zone on lower volume and stronger delta/CVD confirmation, signaling demand returning and absorption of supply. But this is all to be determined.
This doesn't have to play out exactly as I mapped. But if we see something similar play out, it would lead to higher prices and confirmation of the mark-up phase. Until then, patience is key, this phase of the structure is about traps and tests, not breakouts.
Trade active
Price recently pushed above the prior upthrust level, creating what appears to be a second Upthrust Action (UTA) or a bull trap, a classic Wyckoff behavior in Reaccumulation Schematic #2. This move lacked strong volume or delta follow through and quickly pulled back, creating a likely fakeout. However, if price can hold this level it would make it a Sign of Strength, which means price would continue up. So far volume and delta are not support this as a SOS. Interestingly, a fakeout or bull trap aligns with Lunar Day 22, which often brings volatility, false breakouts, and energetic reversals — especially as the Moon transitions out of Mars and Venus phases.
Going forward, we could see price drift back below the Automatic Reaction (AR) level, forming a creek and potentially setting up a spring or spring + test to trap short.
Trade closed: stop reached
Price looks to be accepting at the higher level. This would make upthrust #2 a Sign of Strength. Meaning we should not see the retracement back below the AR. I am expecting a strong bullish continuation to the upper channel trendline. It is now Lunar day 23, this is a high risk, higher energy day. A good day to use momentum and fade extreme moves. Buying climaxes, selling climaxes, and the end of Phase D in wyckoff patterns tend to happen on this day. The current Sign of Strength is midpoint of Phase D in Wyckoff Reaccumulation, and a upward breakout typically follows. Note
I know I've flipped my sentiment a few times already but I think my eyes were deceiving me and wanting this to be bullish. I am now seeing that price is distributing, but in a very deceptive way. Reasons for flipping bearish:
1. Volume Delta: Recent bars show weak or negative volume delta (buyers getting absorbed or sellers taking control). This is happening at or near the highs, which is a key sign of buyer exhaustion.
2. CVD (Cumulative Volume Delta): CVD is trending lower even while price made higher highs (divergence). This implies, aggressive buyers are entering but not moving price up, absorption by large sellers.
3. SVD+CVD (Smart Volume Delta): I am seeing conflicting signs (green and red bars), but the net movement shows negative cumulative flow in recent bars, reinforcing the idea that buying is being met with strong selling.
Other things to note. I also redrew my trendlines more accurately, showing price pushing above the upper trendline and struggling to stay above. The up move after the upthrust isn't showing much conviction or effort from buyers, signaling momentum is weakening.
Note
Failed Bull flag and Confirming Bearish Momentum-Relative Strength of Volume and Relative Strength of Price both trending down
-Volume declining on last rally
-CVD negative
-No aggressive buying effort on Test
Note
Looks good to sell. Be on the lookout for a possible bounce off the PSY level Note
Hold on shorts, looks like it wants to move higher into the liquidity zone before breaking downDisclaimer
The information and publications are not meant to be, and do not constitute, financial, investment, trading, or other types of advice or recommendations supplied or endorsed by TradingView. Read more in the Terms of Use.
Disclaimer
The information and publications are not meant to be, and do not constitute, financial, investment, trading, or other types of advice or recommendations supplied or endorsed by TradingView. Read more in the Terms of Use.