After a resilient summer run, US equities are now facing a new wave of pressure. Friday’s slide was more than just a reaction to headlines, it may be the first sign of a deeper shift in sentiment.
Jobs Data Disappoints as Tariff Tensions Rise
Friday’s US jobs report was a jolt. Just 73,000 nonfarm payrolls were added in July, well short of the 110,000 expected. But the real gut punch came from the revisions. June’s figure was slashed from 147,000 to just 14,000 and May’s total was lowered by another 125,000. Taken together, that is over a quarter of a million fewer jobs than previously reported. The softening labour market has now pushed the probability of a September rate cut to 66%, as traders start to price in a more cautious Fed response.
If that was not enough, President Trump added fresh fuel to the fire by announcing a new round of tariff hikes. Imports from Canada will now face a 35% levy, up from 25%, while goods routed through third countries to avoid duties will be hit with a 40% charge. These measures come at a time when the global economy is already under strain, and investors wasted no time in pulling back. Tech and financials bore the brunt, with Amazon and JPMorgan among the hardest hit.
Short Term Momentum Breaks Down
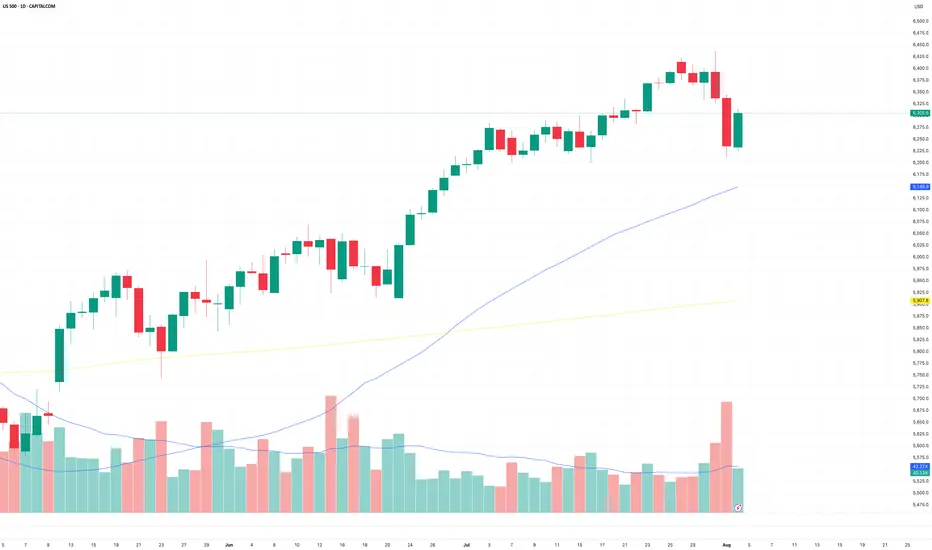
Last week’s price action marked a clear change in tone. The S&P 500 attempted to break to fresh highs on Thursday but was met with a wave of selling on increased volume, forming a bearish engulfing candle. That move was followed by a sharp decline on Friday after the jobs data landed. This two-day drop, coming on elevated volume, stands out as a clean reversal in short term momentum and is most visible on the hourly chart.
That kind of shift raises an important question about timeframes. If you're a short-term trader focused on hourly candles and below, you will likely be watching for bearish continuation patterns. That could mean looking for brief pauses in the selling, flags or consolidations, before another leg lower.
Longer term traders will be reading the chart differently. While short term momentum has clearly turned, the longer-term structure is still intact. The market is now pulling back into a key zone of former resistance from earlier in the year. This cluster of highs, once broken, now acts as support, and just so happens to line up with the 50-day moving average. For those taking a wider lens, this is the kind of area where trend followers could look to reload.
US500 Daily Candle Chart

Past performance is not a reliable indicator of future results
US500 Hourly Candle Chart

Past performance is not a reliable indicator of future results
Disclaimer: This is for information and learning purposes only. The information provided does not constitute investment advice nor take into account the individual financial circumstances or objectives of any investor. Any information that may be provided relating to past performance is not a reliable indicator of future results or performance. Social media channels are not relevant for UK residents.
Spread bets and CFDs are complex instruments and come with a high risk of losing money rapidly due to leverage. 85.24% of retail investor accounts lose money when trading spread bets and CFDs with this provider. You should consider whether you understand how spread bets and CFDs work and whether you can afford to take the high risk of losing your money.
Jobs Data Disappoints as Tariff Tensions Rise
Friday’s US jobs report was a jolt. Just 73,000 nonfarm payrolls were added in July, well short of the 110,000 expected. But the real gut punch came from the revisions. June’s figure was slashed from 147,000 to just 14,000 and May’s total was lowered by another 125,000. Taken together, that is over a quarter of a million fewer jobs than previously reported. The softening labour market has now pushed the probability of a September rate cut to 66%, as traders start to price in a more cautious Fed response.
If that was not enough, President Trump added fresh fuel to the fire by announcing a new round of tariff hikes. Imports from Canada will now face a 35% levy, up from 25%, while goods routed through third countries to avoid duties will be hit with a 40% charge. These measures come at a time when the global economy is already under strain, and investors wasted no time in pulling back. Tech and financials bore the brunt, with Amazon and JPMorgan among the hardest hit.
Short Term Momentum Breaks Down
Last week’s price action marked a clear change in tone. The S&P 500 attempted to break to fresh highs on Thursday but was met with a wave of selling on increased volume, forming a bearish engulfing candle. That move was followed by a sharp decline on Friday after the jobs data landed. This two-day drop, coming on elevated volume, stands out as a clean reversal in short term momentum and is most visible on the hourly chart.
That kind of shift raises an important question about timeframes. If you're a short-term trader focused on hourly candles and below, you will likely be watching for bearish continuation patterns. That could mean looking for brief pauses in the selling, flags or consolidations, before another leg lower.
Longer term traders will be reading the chart differently. While short term momentum has clearly turned, the longer-term structure is still intact. The market is now pulling back into a key zone of former resistance from earlier in the year. This cluster of highs, once broken, now acts as support, and just so happens to line up with the 50-day moving average. For those taking a wider lens, this is the kind of area where trend followers could look to reload.
US500 Daily Candle Chart
Past performance is not a reliable indicator of future results
US500 Hourly Candle Chart
Past performance is not a reliable indicator of future results
Disclaimer: This is for information and learning purposes only. The information provided does not constitute investment advice nor take into account the individual financial circumstances or objectives of any investor. Any information that may be provided relating to past performance is not a reliable indicator of future results or performance. Social media channels are not relevant for UK residents.
Spread bets and CFDs are complex instruments and come with a high risk of losing money rapidly due to leverage. 85.24% of retail investor accounts lose money when trading spread bets and CFDs with this provider. You should consider whether you understand how spread bets and CFDs work and whether you can afford to take the high risk of losing your money.
Disclaimer
The information and publications are not meant to be, and do not constitute, financial, investment, trading, or other types of advice or recommendations supplied or endorsed by TradingView. Read more in the Terms of Use.
Disclaimer
The information and publications are not meant to be, and do not constitute, financial, investment, trading, or other types of advice or recommendations supplied or endorsed by TradingView. Read more in the Terms of Use.