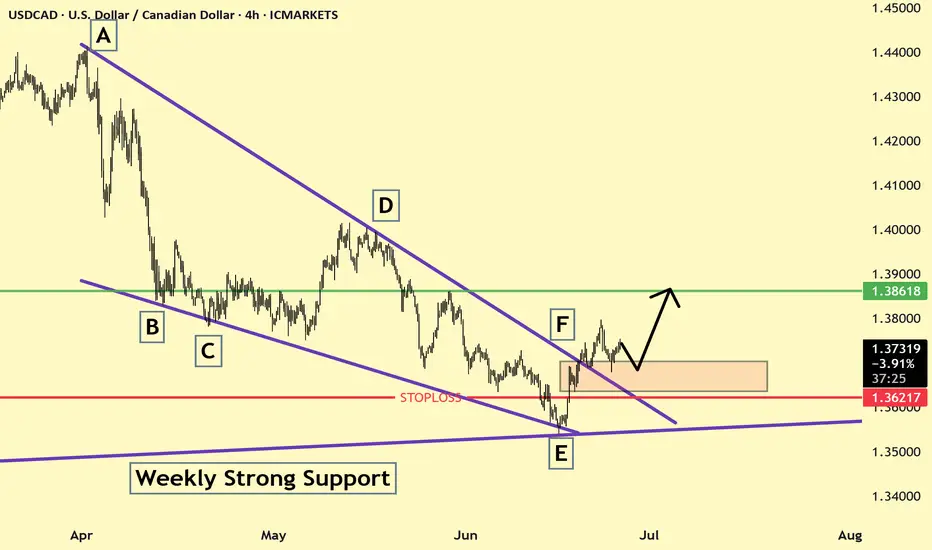
The USDCAD 4H chart shows a completed falling wedge pattern with a breakout near point F. Price is currently pulling back into a key demand zone, suggesting a bullish retest before a potential continuation toward the 1.38618 target. A strong weekly support level underpins the move, with stop loss set below 1.36217 to manage risk.
Disclaimer
The information and publications are not meant to be, and do not constitute, financial, investment, trading, or other types of advice or recommendations supplied or endorsed by TradingView. Read more in the Terms of Use.
Disclaimer
The information and publications are not meant to be, and do not constitute, financial, investment, trading, or other types of advice or recommendations supplied or endorsed by TradingView. Read more in the Terms of Use.