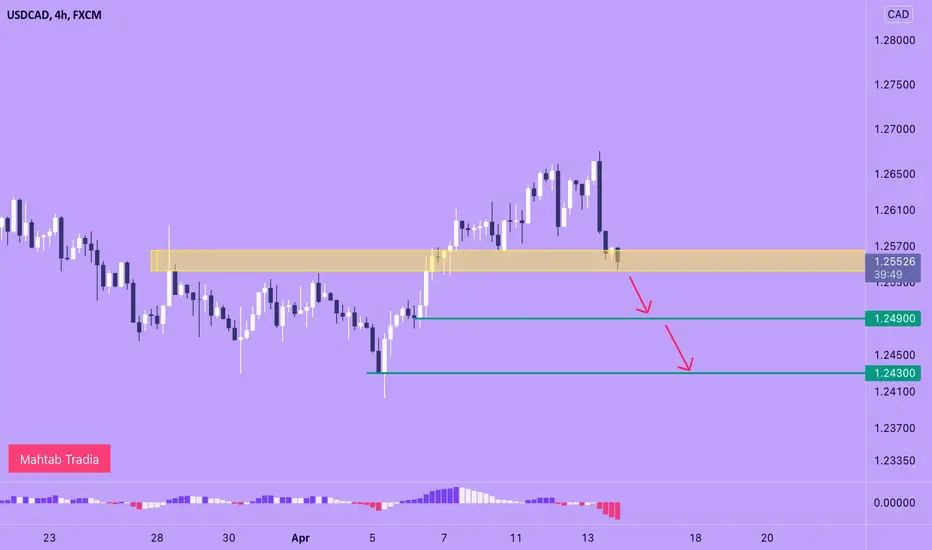
As you see in the 4H chart, price has made a reversal double top pattern after an upside retrace move.
Currently, the downside breakout on the pattern’s neckline has occurred, but price has approached to the yellow support zone and we should wait to see if it can break it or not.
Since we are facing a strong bearish pressure, if price breaks the yellow support zone and closes bearish confirmation candle below this level, I expect a fall on USDCAD around 1.2490 and 1.2430 which are the next support levels.
Disclaimer
The information and publications are not meant to be, and do not constitute, financial, investment, trading, or other types of advice or recommendations supplied or endorsed by TradingView. Read more in the Terms of Use.
Disclaimer
The information and publications are not meant to be, and do not constitute, financial, investment, trading, or other types of advice or recommendations supplied or endorsed by TradingView. Read more in the Terms of Use.