🔹Technical Analysis: USD/CHF 4-Hour Chart
▪️Key Zones
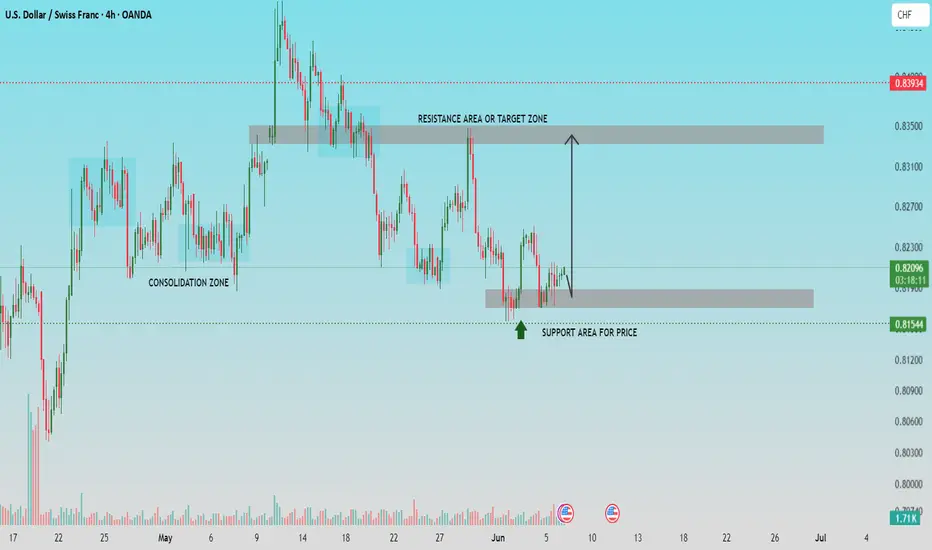
▪️ Support Area: The 0.8155-0.8185 zone has acted as a strong demand level, with multiple rejections indicating buyer interest.
▪️Resistance/Target Area: The 0.8325-0.8350 zone is a well-defined supply level where previous rallies reversed, marking it as the key upside target.
▪️Market Structure
▫️ Consolidation Zone: Earlier in May, the pair moved sideways before breaking out. The recent structure indicates a possible accumulation phase near current support, similar to the previous consolidation.
▫️ Current Price Action: The price is forming a base at the support area and showing signs of bullish interest. A break above the short-term consolidation could signal a move toward the resistance zone.
▪️Trade Outlook
▫️ A bullish move is anticipated from the current support, targeting the resistance zone.
▫️ Confirmation via bullish candlestick patterns or volume increase is advisable before entering long positions.
▪️Bias: Bullish, with potential reversal from support targeting 0.8350.
🔹Community Insight:
If you find this analysis helpful in your trading journey, feel free to share your thoughts or questions in the comments. Let’s work together to maintain a disciplined, technical approach to the markets.
▪️Follow for regular updates and trade setups.
▪️Key Zones
▪️ Support Area: The 0.8155-0.8185 zone has acted as a strong demand level, with multiple rejections indicating buyer interest.
▪️Resistance/Target Area: The 0.8325-0.8350 zone is a well-defined supply level where previous rallies reversed, marking it as the key upside target.
▪️Market Structure
▫️ Consolidation Zone: Earlier in May, the pair moved sideways before breaking out. The recent structure indicates a possible accumulation phase near current support, similar to the previous consolidation.
▫️ Current Price Action: The price is forming a base at the support area and showing signs of bullish interest. A break above the short-term consolidation could signal a move toward the resistance zone.
▪️Trade Outlook
▫️ A bullish move is anticipated from the current support, targeting the resistance zone.
▫️ Confirmation via bullish candlestick patterns or volume increase is advisable before entering long positions.
▪️Bias: Bullish, with potential reversal from support targeting 0.8350.
🔹Community Insight:
If you find this analysis helpful in your trading journey, feel free to share your thoughts or questions in the comments. Let’s work together to maintain a disciplined, technical approach to the markets.
▪️Follow for regular updates and trade setups.
Trade active
Note
it's running good pipsRelated publications
Disclaimer
The information and publications are not meant to be, and do not constitute, financial, investment, trading, or other types of advice or recommendations supplied or endorsed by TradingView. Read more in the Terms of Use.
Related publications
Disclaimer
The information and publications are not meant to be, and do not constitute, financial, investment, trading, or other types of advice or recommendations supplied or endorsed by TradingView. Read more in the Terms of Use.