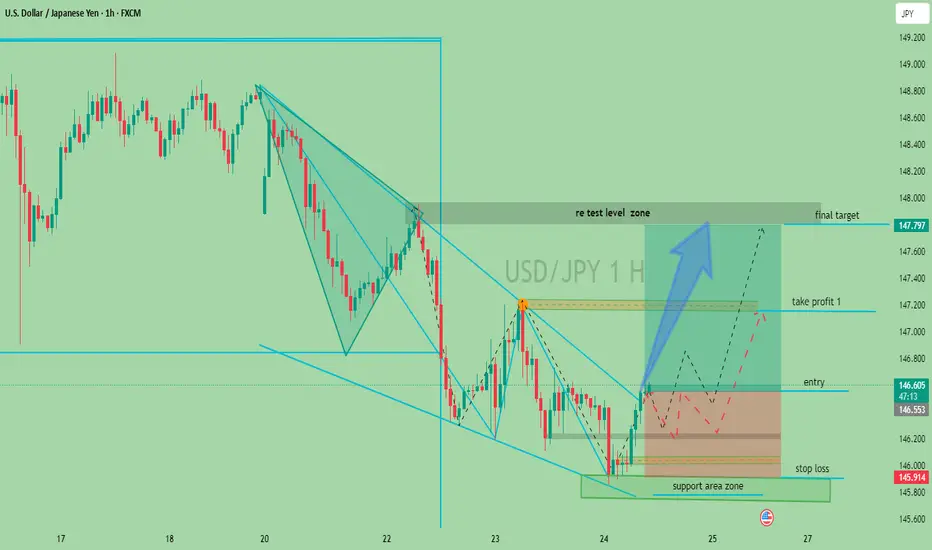
Your USD/JPY 1H chart shows a potential long setup based on a breakout from a falling wedge pattern and confirmation from a support zone.
Timeframe: 1 Hour
Pair: USD/JPY
Bias: Bullish (Long position setup)
Key Elements on the Chart
1. Falling Wedge Pattern (Bullish)
Price has broken out of a falling wedge, a common bullish reversal signal.
Breakout confirms potential shift in trend.
2. Support Area Zone
Price respected the support around 145.900–146.000, forming a base.
This support zone is marked as the entry area.
3. Entry Point
Marked slightly above 146.550.
Currently, the price is 146.611, slightly above the entry.
4. Retest Zone
Price is expected to retest the breakout area (orange zone) before rallying.
🎯 Targets and Risk Management
Level Price Note
Stop Loss 145.914 Below support
Take Profit 1 ~147.200 First reaction zone
Final Target 147.797 Based on previous structure
Trade Idea Summary
Buy near: 146.550–146.600 (on confirmation of retest or continuation).
Stop Loss: 145.914
Take Profit 1: ~147.200
Final Target: 147.797
Trade closed: target reached
congratulation guys our all target has been achieved successfully closed with all tps is hitting at this range of buying setup Best Analysis xauusd single
t.me/+SAB5y_Kpm8RjYjlk
VIP PREMIMUM ANALYSIS ROOM SIGNALS
t.me/+SAB5y_Kpm8RjYjlk
t.me/+SAB5y_Kpm8RjYjlk
VIP PREMIMUM ANALYSIS ROOM SIGNALS
t.me/+SAB5y_Kpm8RjYjlk
Disclaimer
The information and publications are not meant to be, and do not constitute, financial, investment, trading, or other types of advice or recommendations supplied or endorsed by TradingView. Read more in the Terms of Use.
Best Analysis xauusd single
t.me/+SAB5y_Kpm8RjYjlk
VIP PREMIMUM ANALYSIS ROOM SIGNALS
t.me/+SAB5y_Kpm8RjYjlk
t.me/+SAB5y_Kpm8RjYjlk
VIP PREMIMUM ANALYSIS ROOM SIGNALS
t.me/+SAB5y_Kpm8RjYjlk
Disclaimer
The information and publications are not meant to be, and do not constitute, financial, investment, trading, or other types of advice or recommendations supplied or endorsed by TradingView. Read more in the Terms of Use.