Hello Trader
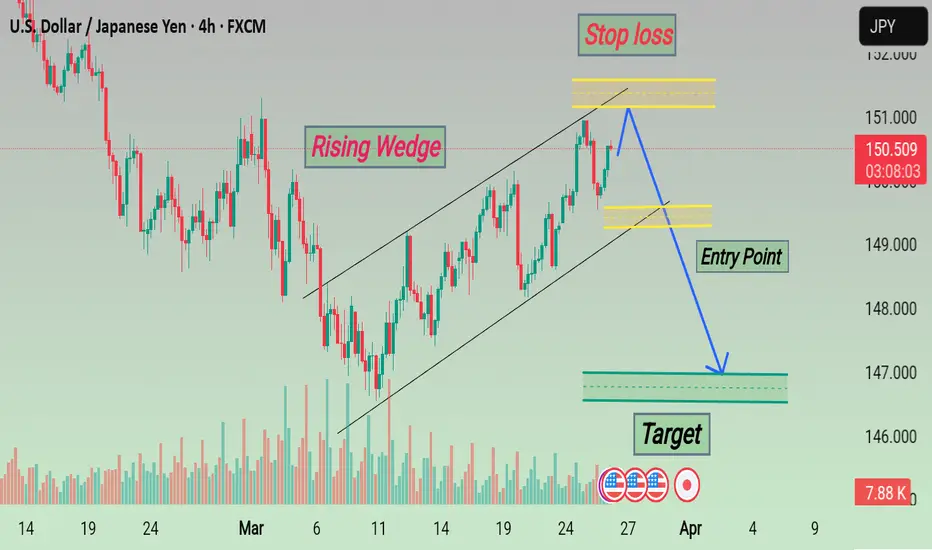
The USD/JPY chart you provided illustrates a Rising Wedge pattern, which is typically a bearish reversal signal. Here’s a breakdown of the key elements in your chart:
1. Rising Wedge Pattern
The price is moving within an upward-sloping wedge, where the highs and lows converge.
This pattern suggests weakening bullish momentum, often leading to a breakdown.
2. Key Trading Levels
Stop Loss (SL): Marked at the upper resistance level of the wedge. This is where the trade would be invalidated if price moves higher instead of breaking down.
Entry Point: Marked slightly below the wedge's lower trendline. A short position (sell) would be triggered when price breaks below the wedge.
Target: Placed around 146.000, aligning with previous support zones. This is the expected price level where the downward move could find support.
Trading Strategy
Sell when price breaks below the lower trendline.
Stop Loss above the recent highs to protect against invalidation.
Take Profit at the target level, based on the previous price structure.
This setup aligns with technical analysis principles, suggesting a potential short opportunity if the price follows the expected breakdown. Would you like help with any further details?
Related publications
Disclaimer
The information and publications are not meant to be, and do not constitute, financial, investment, trading, or other types of advice or recommendations supplied or endorsed by TradingView. Read more in the Terms of Use.
Related publications
Disclaimer
The information and publications are not meant to be, and do not constitute, financial, investment, trading, or other types of advice or recommendations supplied or endorsed by TradingView. Read more in the Terms of Use.