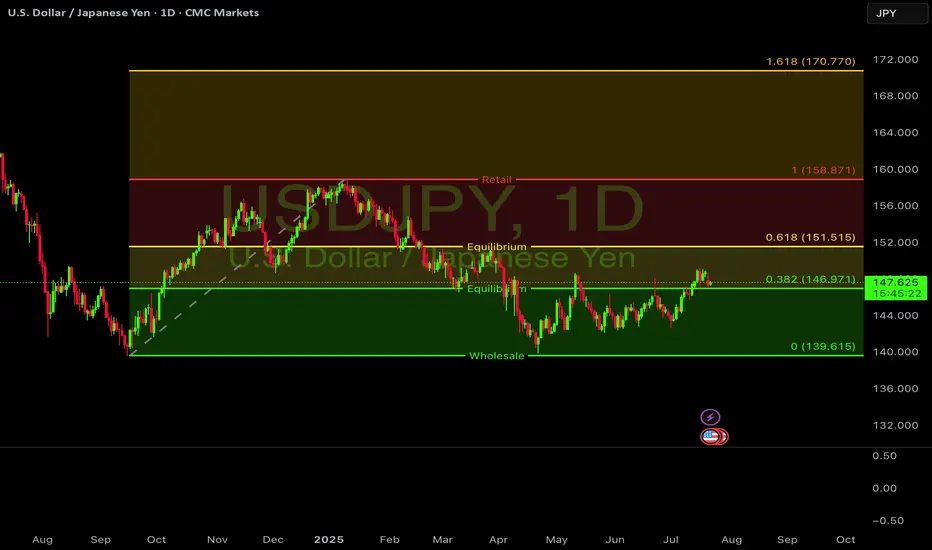
The weekly chart shows a textbook Stage 2 uptrend, holding strong above the 200 EMA. After a healthy pullback, the price is now testing a key pivot level around 147.60, which aligns with a major support zone.
On the 4-hour chart, the Stochastic oscillator is approaching oversold territory, suggesting the recent selling pressure may be exhausted. A bounce from this support could be the catalyst for a move back to the 155-160 resistance area.
#USDJPY #Forex #FX #Trading #Bullish
Disclaimer
The information and publications are not meant to be, and do not constitute, financial, investment, trading, or other types of advice or recommendations supplied or endorsed by TradingView. Read more in the Terms of Use.
Disclaimer
The information and publications are not meant to be, and do not constitute, financial, investment, trading, or other types of advice or recommendations supplied or endorsed by TradingView. Read more in the Terms of Use.