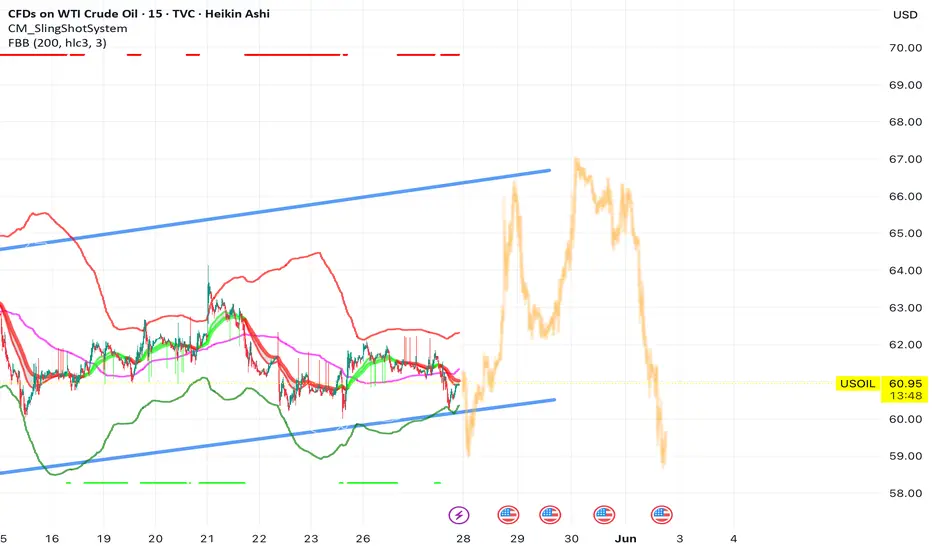
The chart shows a clear sideways or range-bound market structure within an ascending channel, defined by the two bold blue trendlines. The current price action fluctuates between the support near $58.75 and resistance close to $67.00, making this a candidate for a range trading strategy.
Key Observations:
Support Zone (~$58.75):
This level aligns with the lower blue trendline.
Price historically finds buyers here, making it a potential long entry zone.
Matches with projected lower volatility expansion bands (green line).
Resistance Zone (~$67.00):
Corresponds to the upper blue trendline and a previous high.
The price has been rejected here several times, confirming it as a sell/short zone.
Disclaimer
The information and publications are not meant to be, and do not constitute, financial, investment, trading, or other types of advice or recommendations supplied or endorsed by TradingView. Read more in the Terms of Use.
Disclaimer
The information and publications are not meant to be, and do not constitute, financial, investment, trading, or other types of advice or recommendations supplied or endorsed by TradingView. Read more in the Terms of Use.