
Volatility Index (VIX) is an indicator of volatility and investor sentiment. VIX shows market expectations for the short-term volatility of the S&P 500 index.
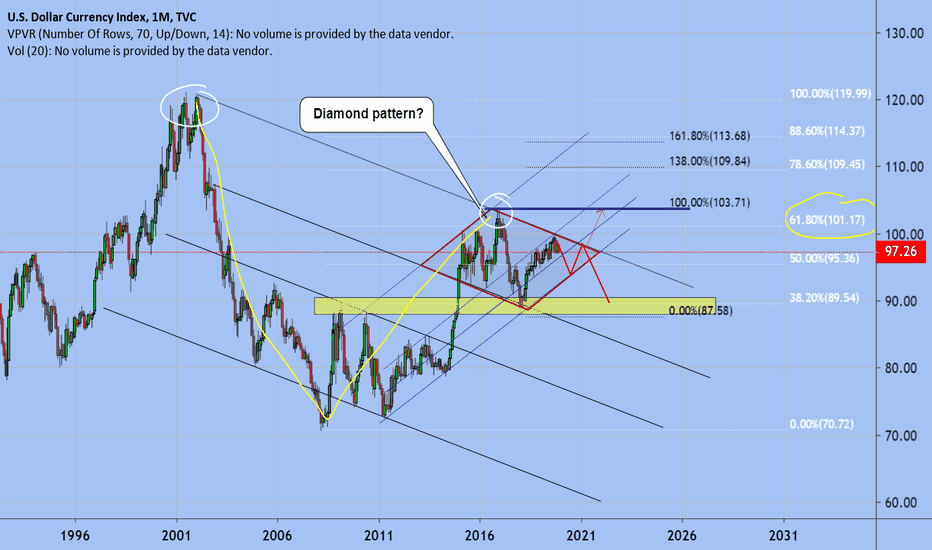
We look at the long-term chart, then you will see in 2008 the index was around 70
Now we can see 54 for 2 months
Last time the crisis was launched within two months - the mortgage crisis of 2007-2008
Now everyone is leaving the market. Oil falls, it all started with the Trump (USA) trade war and China
It was all beneficial to American manufacturers.
What happened after Italy Russia China agreed and signed a $ 100 billion contract - a trade contract without US involvement.
China is the largest holder of US debt and the United States did not like this contract.
Partially stopped these processes due to falling markets and due to the virus. As a result, in China, the plants closed.
Russia does not publish data on infected coronavirus
Crude Oil has fallen

The ruble flew up

Index Dollar is falling
|
But the United States does not worry, they think that markets will recover faster, while other markets do not.
Facts that the crisis has begun you can see
Write your comments
Best regards EXCAVO
We look at the long-term chart, then you will see in 2008 the index was around 70
Now we can see 54 for 2 months
Last time the crisis was launched within two months - the mortgage crisis of 2007-2008
Now everyone is leaving the market. Oil falls, it all started with the Trump (USA) trade war and China
It was all beneficial to American manufacturers.
What happened after Italy Russia China agreed and signed a $ 100 billion contract - a trade contract without US involvement.
China is the largest holder of US debt and the United States did not like this contract.
Partially stopped these processes due to falling markets and due to the virus. As a result, in China, the plants closed.
Russia does not publish data on infected coronavirus
Crude Oil has fallen
The ruble flew up
Index Dollar is falling
|
But the United States does not worry, they think that markets will recover faster, while other markets do not.
Facts that the crisis has begun you can see
Write your comments
Best regards EXCAVO
Register on these two exchanges
Send me confirmation and get VIP group for 3+ months
partner.bybit.com/b/excavo
whitebit.com/a/excavo
All info
excavo.carrd.co/
t.me/EXCAVOACADEMY
t.me/excavochannel
Send me confirmation and get VIP group for 3+ months
partner.bybit.com/b/excavo
whitebit.com/a/excavo
All info
excavo.carrd.co/
t.me/EXCAVOACADEMY
t.me/excavochannel
Related publications
Disclaimer
The information and publications are not meant to be, and do not constitute, financial, investment, trading, or other types of advice or recommendations supplied or endorsed by TradingView. Read more in the Terms of Use.