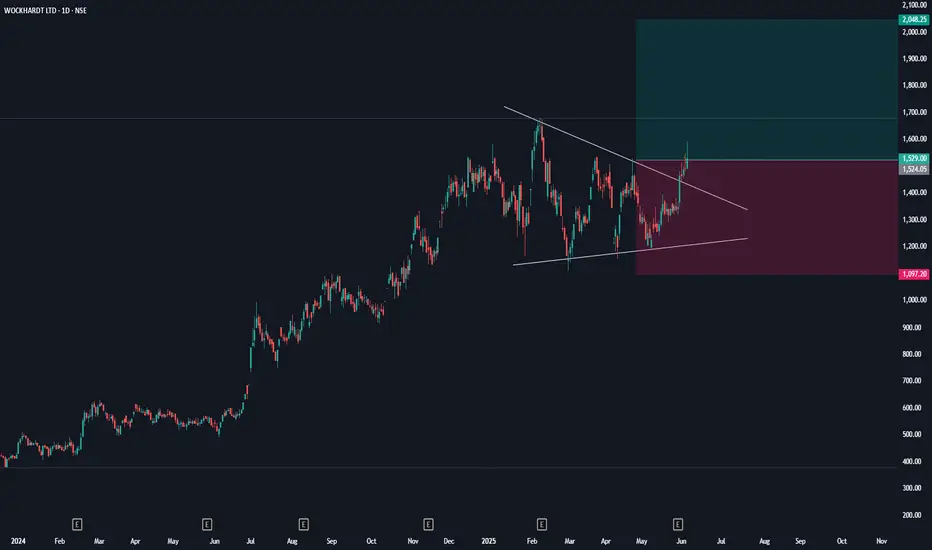
The chart indicates a bullish setup with the price near the upper trendline. A breakout above 1,529 would confirm a bullish continuation, while a breakdown below 1,097 could signal a bearish reversal. Traders should monitor volume and use appropriate risk management strategies.
1. Understanding the Channel Formation
Channel Definition : A channel is formed by drawing two parallel trendlines. One line connects the highs (resistance), and the other connects the lows (support). In this chart:
The upper trendline connects the higher highs, acting as resistance.
The lower trendline connects the lower lows, acting as support.
Current Position : The price is currently near the upper trendline, indicating potential resistance. If the price breaks above this line, it could signal a bullish breakout.
2. Trend Identification
Upward Trend : The overall direction of the price movement is upward, as indicated by the rising trendlines. This suggests a bullish trend.
Consolidation Phase : The recent price action shows consolidation within the channel, which is typical after a strong uptrend. Consolidation often precedes a continuation or reversal.
3. Support and Resistance Levels
Support : The lower trendline acts as dynamic support. If the price approaches this line, it may find buying interest, potentially reversing downward momentum.
Resistance : The upper trendline acts as dynamic resistance. If the price breaks above this line, it could indicate a continuation of the uptrend.
4. Market Psychology and Trading Zones
Trading Zone : According to AL Brooks, the trading zone is the area between support and resistance. In this case, the trading zone is between the lower and upper trendlines.
Bullish Scenario : If the price breaks above the upper trendline (1,529), it would suggest a bullish breakout, indicating strong buying pressure.
Bearish Scenario : If the price breaks below the lower trendline (1,097), it could signal a bearish breakdown, indicating weakness.
Disclaimer
The information and publications are not meant to be, and do not constitute, financial, investment, trading, or other types of advice or recommendations supplied or endorsed by TradingView. Read more in the Terms of Use.
Disclaimer
The information and publications are not meant to be, and do not constitute, financial, investment, trading, or other types of advice or recommendations supplied or endorsed by TradingView. Read more in the Terms of Use.