🔍 Overview
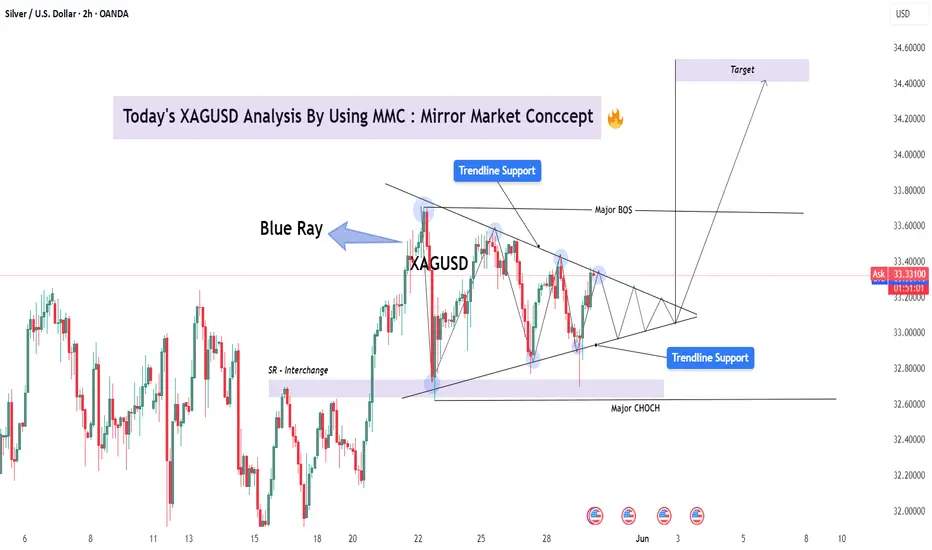
This XAGUSD chart presents a classic Mirror Market Concept (MMC) pattern – a fractal, symmetrical market behavior often observed at key inflection points. The structure is currently forming a tight triangle pattern within two converging trendlines, signaling a compression phase before a significant breakout.
Mirror Market Concept relies on the idea that historical emotional market structures tend to repeat or reflect, especially in psychologically sensitive zones such as trendline tests, liquidity pools, and BOS/CHoCH areas.
📐 Technical Structure Breakdown
🔷 1. Trendline Resistance & Support (Triangle Compression)
Upper trendline connects successive lower highs, reflecting consistent seller pressure.
Lower trendline aligns with higher lows, showing bullish defense and accumulation pressure.
The result is a symmetrical triangle, often preceding explosive directional moves.
🔹 2. Blue Ray Zone
The "Blue Ray" acts as a historical liquidity pivot — a region where large wicks and rejections happened in both directions.
Price has respected this zone repeatedly, making it a likely impulse trigger area if revisited.
🔄 3. BOS (Break of Structure) and CHoCH (Change of Character)
Major BOS near the $33.60 area indicates a shift in market structure to bullish. The break above previous swing highs suggests buyers gained control temporarily.
Major CHoCH at the base of the triangle reflects where market sentiment shifted, initiating the current series of higher lows.
📍 4. SR Interchange Zone
Previous resistance around $32.80–$33.00 is now acting as support (interchange level), creating a confluence zone with the lower trendline and CHoCH point.
🎯 Forecast & Targets
✅ Bullish Scenario (Primary):
A breakout above the upper triangle trendline and confirmation above $33.60 will validate the bullish breakout setup.
Price Target: $34.40 – $34.60 (based on triangle height + measured move theory)
Expect impulsive follow-through as trapped shorts exit and fresh longs enter.
🚫 Bearish Alternative:
A breakdown below $33.00 with strong volume and bearish retest may invalidate the bullish setup.
In such case, a fall toward $32.20–32.40 is possible — completing a deeper retracement before any resumption of the upward move.
🔍 Market Psychology Behind the Pattern
This triangle represents market indecision, a "coil" where both bulls and bears are losing volatility while absorbing liquidity. The MMC concept teaches us that price often mirrors previous patterns — and the compressed energy inside triangles typically resolves in sharp momentum moves, mirroring the prior impulse.
Expect a strong breakout that "mirrors" the breakout leg from May 22 to May 23. This type of reflection-based logic is a cornerstone of MMC.
🔔 Trading Plan & Strategy
Entry: Wait for breakout and retest of the triangle boundary (ideally on 1H/2H close).
Stop Loss: Below the most recent swing low inside the triangle.
TP1: $34.10
TP2: $34.40
TP3: $34.60 (psychological level and measured move)
⚠️ Risk & News Considerations
Upcoming U.S. economic data events (highlighted on the chart) could act as catalysts. Be prepared for volatility spikes and fakeouts. Always use solid risk management.
For Daily Trade Setups and Forecast: 📈 t.me/xauusdoptimizer
Premium Signals Fr33: 💯 t.me/xauusdoptimizer
🥰🥳🤩
Premium Signals Fr33: 💯 t.me/xauusdoptimizer
🥰🥳🤩
Related publications
Disclaimer
The information and publications are not meant to be, and do not constitute, financial, investment, trading, or other types of advice or recommendations supplied or endorsed by TradingView. Read more in the Terms of Use.