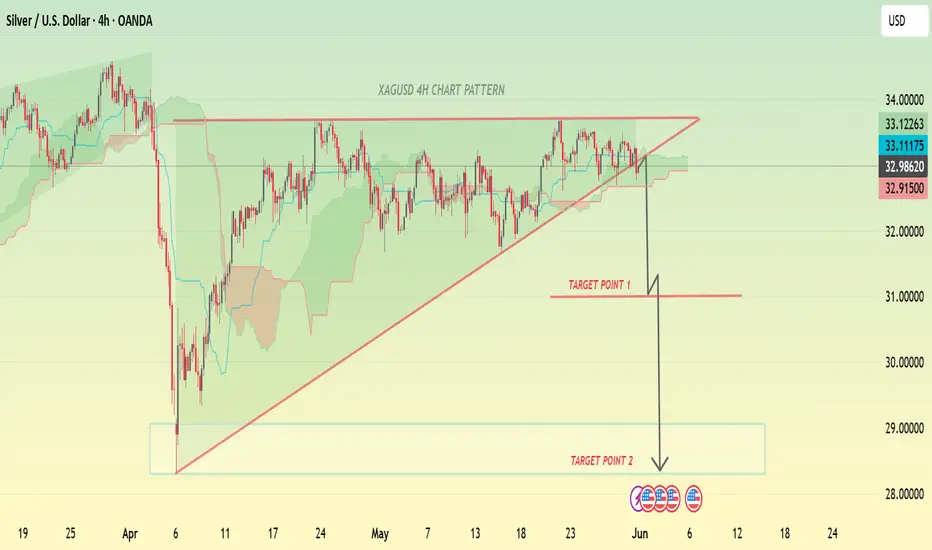
XAGUSD 4H CHART PATTERN ANALYSIS
SELL@32.98
---
Key Technical Levels:
Resistance Zone: $33.15 – $33.50 (upper wedge boundary)
Support (Wedge base): ~$32.60
Breakdown Confirmation: Sustained close below $32.60 (rising trendline support)
Target Point 1: $31.20 (near-term support from previous structure)
Target Point 2: $29.00 (extended bearish target from wedge height projection)
Stop Loss: Above $33.50 (above resistance and invalidation of pattern)
---
Pattern & Price Analysis:
Pattern: Rising Wedge (bearish reversal pattern)
Timeframe: 4-Hour
Trend Prior to Pattern: Bearish impulse followed by a wedge-shaped consolidation
Price Action: Multiple rejections at the upper trendline with weakening bullish momentum near resistance zone (~$33.20–$33.50)
---
Trade Setup:
Entry: On confirmed breakdown below $32.60 (4H close or retest rejection)
Stop Loss: $33.55 (just above wedge resistance)
Target 1: $31.20
Target 2: $29.00
---
Risk-Reward Outlook:
Entry: $32.60
Stop: $33.55 (Risk: $0.95)
Reward 1: $1.40 → RR ≈ 1:1.5
Reward 2: $3.60 → RR ≈ 1:3.8
---
Summary:
The Silver 4H chart shows a rising wedge pattern forming after a sharp drop, typically a bearish continuation structure. Price is consolidating under key resistance with bearish divergence likely forming. A break below the wedge support (~$32.60) could trigger a strong sell-off toward the first target at $31.20 and potentially to $29.00. Traders should look for confirmation before entry, maintain proper risk management, and monitor price behavior at the key levels.
t.me/Smart_Money_Flow_SMF
Forex, Gold & crypto Signals with detailed Analysis .
t.me/Smart_Money_Flow_SMF
Gold Signals With proper TP & SL
Forex, Gold & crypto Signals with detailed Analysis .
t.me/Smart_Money_Flow_SMF
Gold Signals With proper TP & SL
Disclaimer
The information and publications are not meant to be, and do not constitute, financial, investment, trading, or other types of advice or recommendations supplied or endorsed by TradingView. Read more in the Terms of Use.
t.me/Smart_Money_Flow_SMF
Forex, Gold & crypto Signals with detailed Analysis .
t.me/Smart_Money_Flow_SMF
Gold Signals With proper TP & SL
Forex, Gold & crypto Signals with detailed Analysis .
t.me/Smart_Money_Flow_SMF
Gold Signals With proper TP & SL
Disclaimer
The information and publications are not meant to be, and do not constitute, financial, investment, trading, or other types of advice or recommendations supplied or endorsed by TradingView. Read more in the Terms of Use.