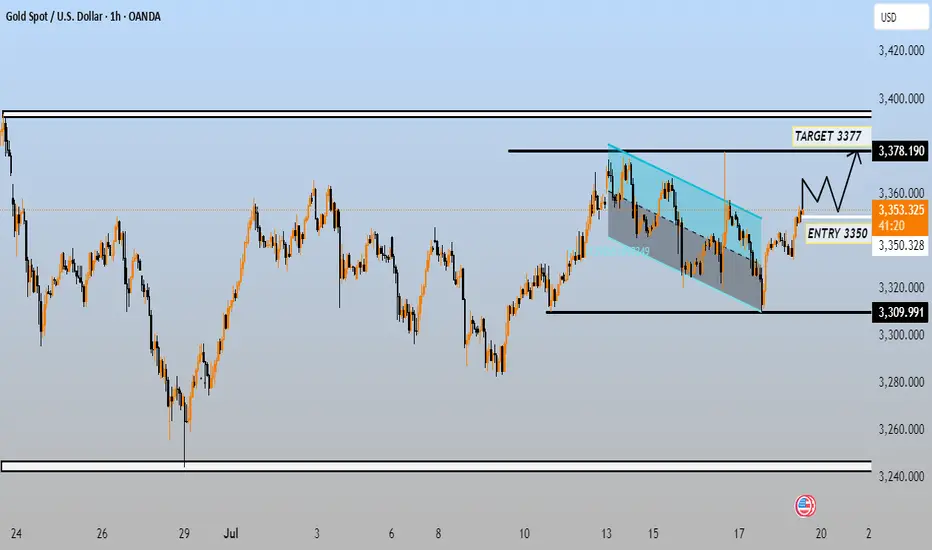
This chart is a technical analysis of Gold Spot (XAU/USD) on the 1-hour timeframe, showing a bullish setup with defined entry and target levels:
Key Elements:
1. Entry Level:
3350 is marked as the optimal entry point for a long (buy) position.
2. Target Level:
3377 is the profit target, just below a resistance zone around 3,378.190.
3. Price Action:
The price broke out of a falling wedge or descending channel, which is a bullish reversal pattern.
This breakout is highlighted by the move above the descending blue channel.
A retest of the breakout zone is suggested before the price moves higher.
4. Support & Resistance Zones:
Support: 3,309.991 (strong horizontal support).
Resistance: 3,378.190 (significant horizontal resistance).
5. Current Price:
At the time of the screenshot, the price is 3,353.080, slightly above the entry level of 3350.
Technical Implication:
The chart suggests a buy-the-dip strategy, targeting 3377 after confirmation of support at 3350.
A bullish bias is in play, provided the price stays above the 3350 entry zone and the 3309.991 support level holds.
Would you like help calculating position size, stop loss, or risk/reward ratio for this trade?
Trade active
270 PIPS DONETrade closed: target reached
TARGET DONEJoin telegram free...
t.me/+16bIVCNBo0MzYzk0
Forex Gold & Crypto Signals with
detailed analysis & get consistent |
result ...
Gold Signals with peoper TP & SL for
high profit ...
t.me/+16bIVCNBo0MzYzk0
t.me/+16bIVCNBo0MzYzk0
Forex Gold & Crypto Signals with
detailed analysis & get consistent |
result ...
Gold Signals with peoper TP & SL for
high profit ...
t.me/+16bIVCNBo0MzYzk0
Disclaimer
The information and publications are not meant to be, and do not constitute, financial, investment, trading, or other types of advice or recommendations supplied or endorsed by TradingView. Read more in the Terms of Use.
Join telegram free...
t.me/+16bIVCNBo0MzYzk0
Forex Gold & Crypto Signals with
detailed analysis & get consistent |
result ...
Gold Signals with peoper TP & SL for
high profit ...
t.me/+16bIVCNBo0MzYzk0
t.me/+16bIVCNBo0MzYzk0
Forex Gold & Crypto Signals with
detailed analysis & get consistent |
result ...
Gold Signals with peoper TP & SL for
high profit ...
t.me/+16bIVCNBo0MzYzk0
Disclaimer
The information and publications are not meant to be, and do not constitute, financial, investment, trading, or other types of advice or recommendations supplied or endorsed by TradingView. Read more in the Terms of Use.