Hello Traders,
Today NFP news coming soon and we are collected 100% sure pips and again killing this news all time.
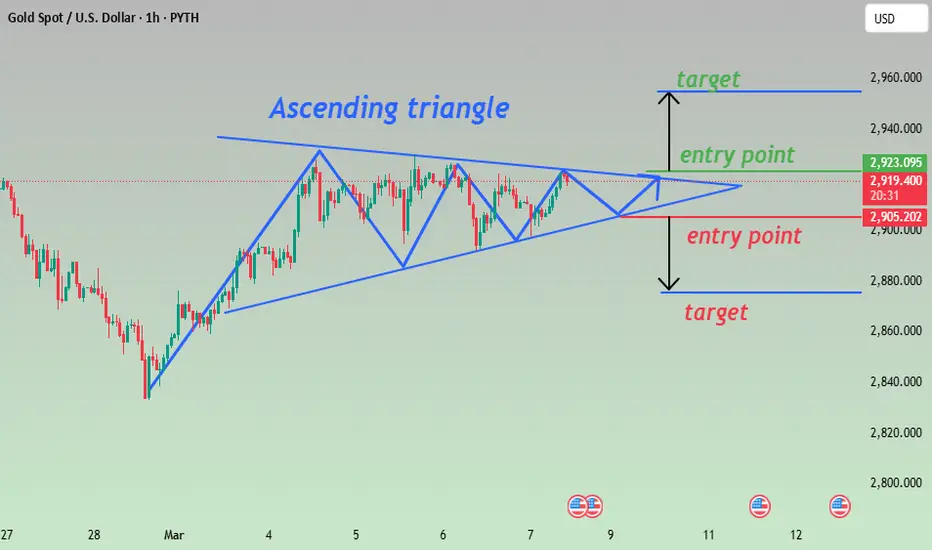
The image shows an ascending triangle pattern on the Gold Spot vs. US Dollar (XAU/USD) 1-hour chart. An ascending triangle is typically a bullish continuation pattern, characterized by a flat resistance level and a series of higher lows.
In this scenario:
The blue lines outline the ascending triangle.
The green "entry point" and "target" labels indicate a potential bullish breakout scenario.
The red "entry point" and "target" labels show a bearish breakout possibility, acknowledging that triangles can break either way.
A trader might look to enter a trade when the price breaks out of the triangle, either to the upside or downside, with a target approximately equal to the height of the triangle added to (or subtracted from) the breakout point.
Would you like me to help you write a post about this chart or provide more analysis?
Today NFP news coming soon and we are collected 100% sure pips and again killing this news all time.
The image shows an ascending triangle pattern on the Gold Spot vs. US Dollar (XAU/USD) 1-hour chart. An ascending triangle is typically a bullish continuation pattern, characterized by a flat resistance level and a series of higher lows.
In this scenario:
The blue lines outline the ascending triangle.
The green "entry point" and "target" labels indicate a potential bullish breakout scenario.
The red "entry point" and "target" labels show a bearish breakout possibility, acknowledging that triangles can break either way.
A trader might look to enter a trade when the price breaks out of the triangle, either to the upside or downside, with a target approximately equal to the height of the triangle added to (or subtracted from) the breakout point.
Would you like me to help you write a post about this chart or provide more analysis?
Disclaimer
The information and publications are not meant to be, and do not constitute, financial, investment, trading, or other types of advice or recommendations supplied or endorsed by TradingView. Read more in the Terms of Use.
Disclaimer
The information and publications are not meant to be, and do not constitute, financial, investment, trading, or other types of advice or recommendations supplied or endorsed by TradingView. Read more in the Terms of Use.