Gold price fluctuation range: 3330-3360
Fed Chairman Powell reiterated his hawkish stance at a hearing on June 26, emphasizing "insufficient progress in inflation", but hinted that if a trade agreement is reached, interest rate cuts may be considered.
Market expectations for a rate cut in September have risen to 74%.
Although Israel and Iran have reached a "comprehensive ceasefire", the terms of the agreement are not symmetrical and conflicts are still ongoing (such as Israel's air strikes on Iran's missile depot).
Market concerns about shipping disruptions in the Strait of Hormuz support gold's safe-haven demand.
Trump announced that he will hold talks with Iran next week, but the market is still worried that the situation may escalate again.
The market is paying attention to the final value of the US first quarter GDP and the PCE inflation data for May to be released later today. If the data exceeds expectations, it may strengthen the Fed's expectations of delaying interest rate cuts, which is bearish for gold.
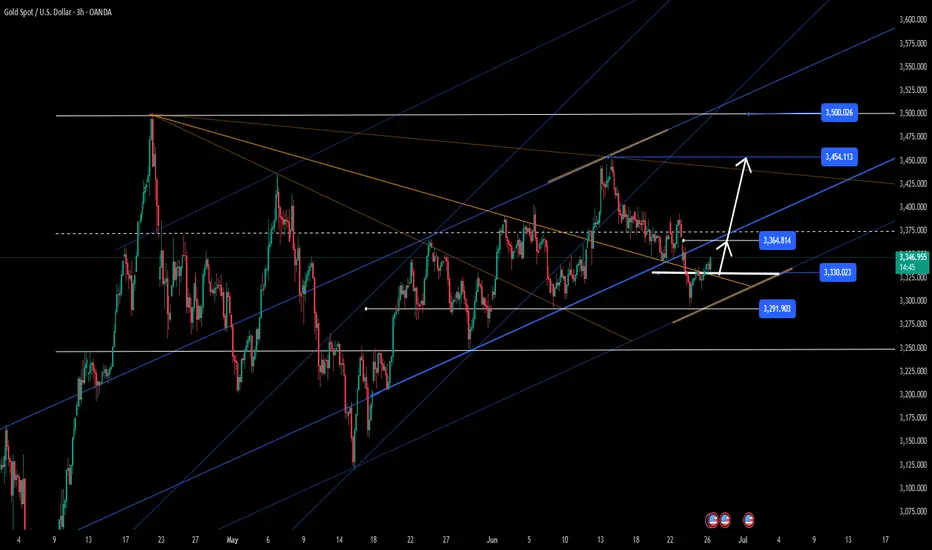
Technical analysis:
Short-term trend: London gold closed with a small negative line, forming a "yin-enclosing-yang" short-term reversal signal.
Short-term support is at $3,330
Short-term resistance is at $3,350
Key range: Gold price fluctuates between $3,300 and $3,360.
If it falls below $3,300, it may fall to $3,250;
If it breaks through $3,360, it may challenge $3,400.
4-hour chart: Bollinger Bands narrowed, and MACD indicator showed signs of golden cross. If a golden cross is formed, it may drive gold price to rebound.
Trading strategy suggestion:
In the past two days, we went long near 3310 points and left near 3330 points.
Today we still maintain the low-price long strategy:
Buy: 3320-3330 points
Stop loss: 3310-3315 points
Target: 3345-3365 points
To sum up: Today's gold price is mainly volatile, and we need to pay close attention to the Fed's policy trends and geopolitical risks.
Intraday trading is still mainly about waiting for low prices to go long
Fed Chairman Powell reiterated his hawkish stance at a hearing on June 26, emphasizing "insufficient progress in inflation", but hinted that if a trade agreement is reached, interest rate cuts may be considered.
Market expectations for a rate cut in September have risen to 74%.
Although Israel and Iran have reached a "comprehensive ceasefire", the terms of the agreement are not symmetrical and conflicts are still ongoing (such as Israel's air strikes on Iran's missile depot).
Market concerns about shipping disruptions in the Strait of Hormuz support gold's safe-haven demand.
Trump announced that he will hold talks with Iran next week, but the market is still worried that the situation may escalate again.
The market is paying attention to the final value of the US first quarter GDP and the PCE inflation data for May to be released later today. If the data exceeds expectations, it may strengthen the Fed's expectations of delaying interest rate cuts, which is bearish for gold.
Technical analysis:
Short-term trend: London gold closed with a small negative line, forming a "yin-enclosing-yang" short-term reversal signal.
Short-term support is at $3,330
Short-term resistance is at $3,350
Key range: Gold price fluctuates between $3,300 and $3,360.
If it falls below $3,300, it may fall to $3,250;
If it breaks through $3,360, it may challenge $3,400.
4-hour chart: Bollinger Bands narrowed, and MACD indicator showed signs of golden cross. If a golden cross is formed, it may drive gold price to rebound.
Trading strategy suggestion:
In the past two days, we went long near 3310 points and left near 3330 points.
Today we still maintain the low-price long strategy:
Buy: 3320-3330 points
Stop loss: 3310-3315 points
Target: 3345-3365 points
To sum up: Today's gold price is mainly volatile, and we need to pay close attention to the Fed's policy trends and geopolitical risks.
Intraday trading is still mainly about waiting for low prices to go long
Disclaimer
The information and publications are not meant to be, and do not constitute, financial, investment, trading, or other types of advice or recommendations supplied or endorsed by TradingView. Read more in the Terms of Use.
Disclaimer
The information and publications are not meant to be, and do not constitute, financial, investment, trading, or other types of advice or recommendations supplied or endorsed by TradingView. Read more in the Terms of Use.