
Continuing directly from post #9, I expect a NEW ALL TIME HIGH ADJUSTED FOR INFLATION.
1) I spent the last hour to reconfirm that this move should be out right favorite
2) and the math is undeniable
3) first 3190-3210 on 04/01 and/or 04/02
4) the retrace to 3100-3120 will absolutely be bought
5) and understand that as I type, price is 3119.xx
6) this can only mean that the 4/11 high should be 3325
7) but further more, I have conviction that this means that...
8) there will be a tag of the 3368+ to hit the RED LINE IN CHART AT TOP
9) which is JANUARY 20, 1980, $875, ALL-TIME-HIGH ...
10) but adjusted for inflation
11) this route blows away routes in parts, 6, 7, 8, and 9
12) this leaves no doubt that 12 month swing hi-low
13) should be 3965-2617 or even 4141-2720
14) and that's where things stand right now
Note
4:42 PM ET - NEVER HAVE MY WORK BEEN MORE VALID AND VALUABLE AND YET...1) I am running out or reasons to keep forecasting and posting
2) if you want this to continue
3) link to the group is under chart at top (if you are on PC)
4) or below before comments if you are on mobile
5) I need to know there's demand for this, and I need to know soon
Note
4:54 PM ET, replay POST #8 here:
1) in this post, all the hi-lights for #6, 7, AND 8 are shown together
2) we DESTROYING THOSE CURVES right now
3) so this is why the target for 4/11 needs to be 3368...
4) I am wondering why it should not be 3400...
Note
5:00 PM ET, I JUST REALIZED WHY THIS IS HAPPENING...1) Trump just confirmed verbally that he gave Iran a 2 month deadline
2) for a deal or a bombing campaign
3) and satellites show the U.S. shoring up assets to do this
4) and the market is taking Trump at his word....
5) so right now I have that 3965 hitting 06/06 and that is ...
6) exactly 67 days out... or
7) 2 months and 1 week
Note
11:18 PM ET, 3140s another record high...1) I just accepted a new job today
2) that has nothing to do with this
3) and I have to accept it because its the one that is paying me
4) or in other words, REAL DEMAND
5) what I do here is really hard to do
6) yet I pay to do it...
7) so I am supposed to stop doing this
8) good night
Note
Note
1) in chart above, this should've been posted 90 minutes ago but I just did not have time 2) so that's price vs dark red since this route was forecasted
3) price is now a "DO OR DIE" time for this route up
4) that bold diagonal from 3148?-ish new all time high is new short term down trend line
5) AS I TYPE RIGHT NOW PRICE IS FAVORED 52-48 to 55-45 to break upwards
6) forming a WEAKER ROUTE TO 3200 but will undoubtedly miss the first top in all scenarios
7) but if it does not and black line holds
8) it is retest of 3100 and then sideways creation of a new route towards 3225
9) therein lies the problem of forecasting
Note
10) if you've followed me for sometime, I've stated countless times that accuracy ...11) is a derivative of how often trend maps are updated
12) which has a time cost that can only be reduced by RAM/AI input
13) of which I do not have any have still today failed to find developers interested in developing...
14) so with the little time that I have with price trading at 3132.xxx
15) if price breaks black line upwards, it will FOLLOW RED ARROW LIKE THIS:
Note
Note
16) where the demand for NEW RED ROUTE IN CHART ABOVE is hold red diagonal 17) as close as possible (bc it does not have to be perfect)
18) and the conditional demand for gray route is to hold black line until...
19) red up trend line and orange down trend line BOTH BREAKS for a successful retest of 3100 ...
20) but should really be 3108-3118 (because I do not see enough bearish strength to push to 3100)
Note
21) in which case price would top 3170++ and miss the first box22) but still right on time for second box
23) it is not obvious yet that new draft would be needed for 4/11-4/13 (Friday-Sunday) high
Note
Note
24) at 12:28 PM ET, price taking gray route and trading 3107.50 after bouncing off 3101.50 25) in chart above, deeper than I anticipated, but not still within bound of retesting 3100
26) despite gray route appearing to win here, it's not a "closed and shut case"
27) as reaction within the first 30-60 minutes usually signals strength of close
28) the bounce up is expected to break above 3122-3126
29) it is then what happens at 3122-3126 that finally decides red or gray
30) the short term no doubt favors gray but this is only guaranteed ..
31) if price STALLS UNDER 3110 FOR A WHILE
32) if the bounce is V shaped, it's not obvious bears can prevent a 3140 NEW YORK CLOSE
33) which would mean red route would be expected to win tomorrow
Note
Note
IF YOU WANT ME TO KEEP WRITING AND FORECASTING...1) I cannot keep writing and forecasting if I do not see a future in this for me
2) so if you find this material helpful and useful
3) if it helps you win, please join the "12 MONTH BASIS WITH SUPER DETAILING GROUP"
4) this group is to gauge demand so I can justify making this a career
5) there are no fees until we hit the June 3965 high
6) but the problem is...
7) right now, I do not even have demand to keep writing next week
8) so if you know a fellow trader, please spread the word because I am all out of ideas
Note
SO HERE IS #10B: 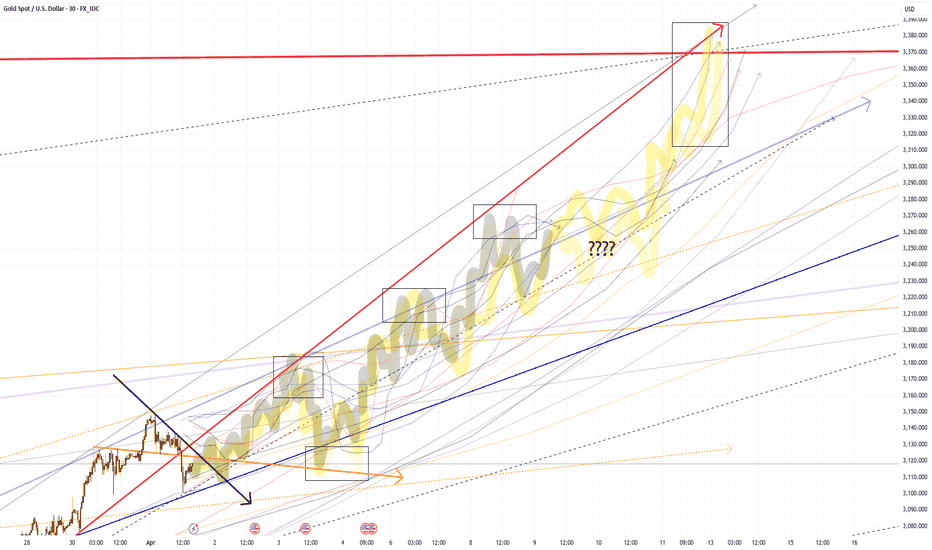
Related publications
Disclaimer
The information and publications are not meant to be, and do not constitute, financial, investment, trading, or other types of advice or recommendations supplied or endorsed by TradingView. Read more in the Terms of Use.
Related publications
Disclaimer
The information and publications are not meant to be, and do not constitute, financial, investment, trading, or other types of advice or recommendations supplied or endorsed by TradingView. Read more in the Terms of Use.