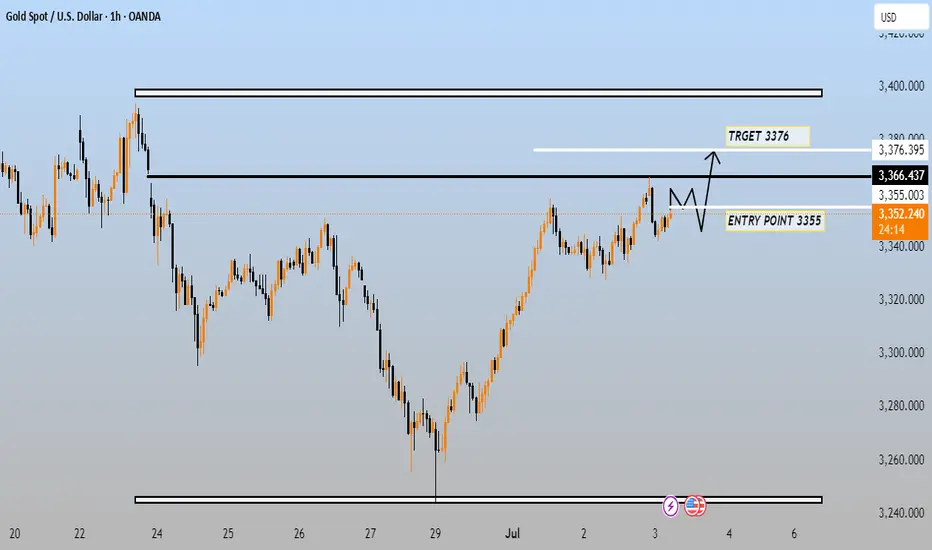
This chart is a technical analysis for Gold Spot (XAU/USD) on the 1-hour timeframe, and it outlines a potential long (buy) trade setup. Here's a breakdown of the key elements:
---
🔍 Key Levels:
Entry Point: 3,355 USD
Target (TP): 3,376 USD
Current Price: Around 3,352.975 USD
Resistance Zone: Near 3,366 USD
Support Zone: Around 3,355 USD
---
📈 Trade Idea Summary:
The chart suggests a buy setup if the price retests 3,355 USD and finds support there.
A bullish continuation is expected after consolidation, with a projected target of 3,376 USD.
The visual arrow and pattern suggest a potential breakout-retest-bounce structure.
---
⚠ Important Notes:
The chart implies waiting for confirmation around 3,355 before entering.
The target level (3,376) sits just below the next resistance area, suggesting a conservative take-profit approach.
No stop-loss is shown, but it should be considered — possibly just below the recent swing low (around 3,340–3,345).
---
Would you like help identifying a stop-loss level, risk/reward ratio, or confirmation signals for this setup?
---
🔍 Key Levels:
Entry Point: 3,355 USD
Target (TP): 3,376 USD
Current Price: Around 3,352.975 USD
Resistance Zone: Near 3,366 USD
Support Zone: Around 3,355 USD
---
📈 Trade Idea Summary:
The chart suggests a buy setup if the price retests 3,355 USD and finds support there.
A bullish continuation is expected after consolidation, with a projected target of 3,376 USD.
The visual arrow and pattern suggest a potential breakout-retest-bounce structure.
---
⚠ Important Notes:
The chart implies waiting for confirmation around 3,355 before entering.
The target level (3,376) sits just below the next resistance area, suggesting a conservative take-profit approach.
No stop-loss is shown, but it should be considered — possibly just below the recent swing low (around 3,340–3,345).
---
Would you like help identifying a stop-loss level, risk/reward ratio, or confirmation signals for this setup?
Disclaimer
The information and publications are not meant to be, and do not constitute, financial, investment, trading, or other types of advice or recommendations supplied or endorsed by TradingView. Read more in the Terms of Use.
Disclaimer
The information and publications are not meant to be, and do not constitute, financial, investment, trading, or other types of advice or recommendations supplied or endorsed by TradingView. Read more in the Terms of Use.