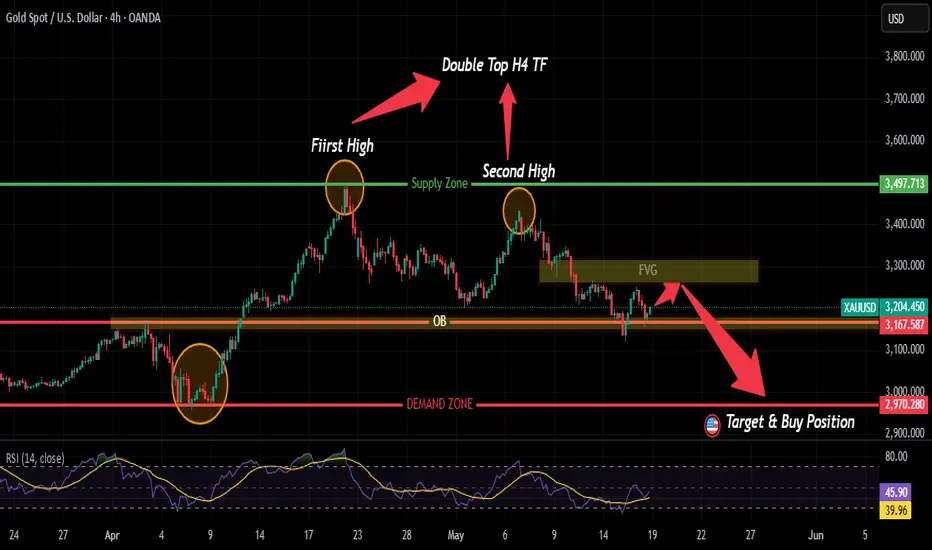
Gold Spot (XAU/USD) – 4H Time Frame
🧠 Key Pattern: Double Top Formation
First High and Second High clearly mark the formation of a Double Top around the $3,497 supply zone.
This classic reversal pattern indicates potential bearish momentum after the second failed attempt to break the previous high.
📉 Supply & Demand Zones
Supply Zone: Around $3,497 (Strong resistance; price rejected twice)
Demand Zone: Between $2,970 and $3,030 (Strong support area highlighted for a buy position)
📦 Fair Value Gap (FVG)
A visible FVG (imbalance) between $3,250 and $3,300 suggests inefficiency, which price might revisit and fill before continuation downward.
🎯 Target & Buy Position
Target and optimal buy area marked at $2,970, aligning with the demand zone.
Strong bullish reaction expected if price touches or sweeps this zone, especially with RSI oversold confirmation.
📊 RSI Indicator (Bottom Panel)
RSI is currently around 45.90, recently bounced from 39.96, indicating:
No overbought condition.
Potential for further downside before bullish momentum resumes near the demand zone.
📌 Summary Strategy
Sell Bias Active due to double top and supply rejection.
Watch for rejection or liquidity sweep near the FVG.
Prepare for buy setups at the $2,970 demand zone, supported by bullish divergence or price action confirmation.
#XAUUSD #XAU #TRADING
Disclaimer
The information and publications are not meant to be, and do not constitute, financial, investment, trading, or other types of advice or recommendations supplied or endorsed by TradingView. Read more in the Terms of Use.
Disclaimer
The information and publications are not meant to be, and do not constitute, financial, investment, trading, or other types of advice or recommendations supplied or endorsed by TradingView. Read more in the Terms of Use.