Gold bulls are accumulating momentum and are about to break
Gold market analysis report: safe-haven demand supports gold prices, and the technical side maintains a bullish pattern
I. Fundamental analysis
1. The weakening of the US dollar and risk aversion boost gold prices
Spot gold closed up 0.35% last Friday (July 19), mainly affected by the decline of the US dollar index and geopolitical uncertainty. Market concerns about the outlook for the global economy, especially the uncertainty of the Fed's policy expectations, have enhanced the safe-haven appeal of gold. In addition, the monthly rate forecast of the Conference Board's leading indicator in June was weaker than the previous value. If the data is weak, it may further suppress the US dollar and benefit gold.
2. Market sentiment tends to be optimistic
The latest survey shows that most analysts are bullish on the outlook for gold, and the proportion of retail investors who are bullish has increased significantly. Against the backdrop of the Fed's possible slowdown in the pace of interest rate hikes, gold, as a non-interest-bearing asset, has become more attractive.
2. Technical Analysis
1. Daily level: bullish trend is stable
Moving average system: MA5 and MA10 form a golden cross, and the price stands firmly on the short-term moving average, indicating that the short-term momentum is strong.
MACD indicator: The red kinetic energy column continues to increase in volume, and the fast and slow lines cross upward, indicating that the buying power is increasing.
KDJ indicator: Continues to diverge upward, and no overbought signal appears, suggesting that there is still room for growth.
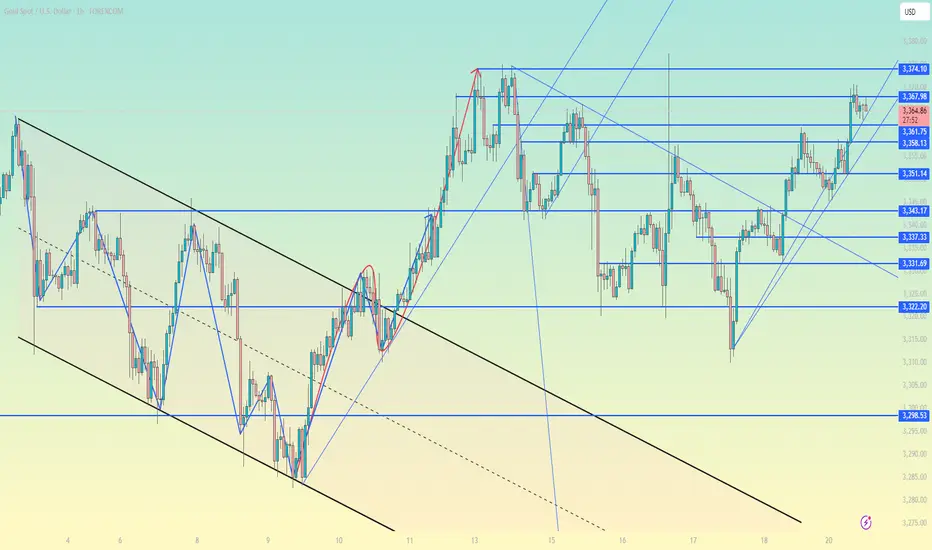
Key points: The upper resistance focuses on US$3,375 (previous high), and it is expected to challenge US$3,430-3,500 after breaking through; the lower support focuses on the 3,310-3,330 area.
2. 4-hour level: short-term shock is strong
Bollinger band: The upper rail opens upward, and the price runs along the middle and upper rails, indicating that the short-term trend is bullish.
MACD and KDJ: Synchronous golden cross, the red kinetic energy column is enlarged, and there is still upward momentum in the short term.
Oscillation range: If it fails to break through 3375, it may maintain the 3375-3310 range oscillation; if it falls back to the 3340-3330 support zone, it can be regarded as a long entry opportunity.
III. Operation strategy
1. Low-long mainly, high-short as auxiliary
Long strategy:
First retracement to 3340-3342, light position long, stop loss 3334, target 3350-3360.
European and American markets retrace to 3330-3332, increase position long, stop loss 3320, target 3350-3360.
Short strategy:
If it rebounds to around 3375, it can be shorted under pressure, stop loss 3382, target 3350-3340 (limited to range oscillation market).
2. Breakthrough market response
Break above 3375: chase long and look to 3430-3500, stop loss 3360.
Breaking below 3310: Be alert to the risk of short-term adjustment, wait and see or short.
IV. Risk Warning
Data risk: Pay attention to the leading indicators of the Conference Board in June. If the data is stronger than expected, it may be bearish for gold in the short term.
Technical correction: If the gold price rises rapidly and then shows a top divergence signal, be alert to the risk of a correction.
Conclusion: Gold is in a bullish trend as a whole. The operation is mainly to go long after the retracement. Focus on the support area of 3340-3330. A breakthrough above 3375 will open up more room for growth.
Gold market analysis report: safe-haven demand supports gold prices, and the technical side maintains a bullish pattern
I. Fundamental analysis
1. The weakening of the US dollar and risk aversion boost gold prices
Spot gold closed up 0.35% last Friday (July 19), mainly affected by the decline of the US dollar index and geopolitical uncertainty. Market concerns about the outlook for the global economy, especially the uncertainty of the Fed's policy expectations, have enhanced the safe-haven appeal of gold. In addition, the monthly rate forecast of the Conference Board's leading indicator in June was weaker than the previous value. If the data is weak, it may further suppress the US dollar and benefit gold.
2. Market sentiment tends to be optimistic
The latest survey shows that most analysts are bullish on the outlook for gold, and the proportion of retail investors who are bullish has increased significantly. Against the backdrop of the Fed's possible slowdown in the pace of interest rate hikes, gold, as a non-interest-bearing asset, has become more attractive.
2. Technical Analysis
1. Daily level: bullish trend is stable
Moving average system: MA5 and MA10 form a golden cross, and the price stands firmly on the short-term moving average, indicating that the short-term momentum is strong.
MACD indicator: The red kinetic energy column continues to increase in volume, and the fast and slow lines cross upward, indicating that the buying power is increasing.
KDJ indicator: Continues to diverge upward, and no overbought signal appears, suggesting that there is still room for growth.
Key points: The upper resistance focuses on US$3,375 (previous high), and it is expected to challenge US$3,430-3,500 after breaking through; the lower support focuses on the 3,310-3,330 area.
2. 4-hour level: short-term shock is strong
Bollinger band: The upper rail opens upward, and the price runs along the middle and upper rails, indicating that the short-term trend is bullish.
MACD and KDJ: Synchronous golden cross, the red kinetic energy column is enlarged, and there is still upward momentum in the short term.
Oscillation range: If it fails to break through 3375, it may maintain the 3375-3310 range oscillation; if it falls back to the 3340-3330 support zone, it can be regarded as a long entry opportunity.
III. Operation strategy
1. Low-long mainly, high-short as auxiliary
Long strategy:
First retracement to 3340-3342, light position long, stop loss 3334, target 3350-3360.
European and American markets retrace to 3330-3332, increase position long, stop loss 3320, target 3350-3360.
Short strategy:
If it rebounds to around 3375, it can be shorted under pressure, stop loss 3382, target 3350-3340 (limited to range oscillation market).
2. Breakthrough market response
Break above 3375: chase long and look to 3430-3500, stop loss 3360.
Breaking below 3310: Be alert to the risk of short-term adjustment, wait and see or short.
IV. Risk Warning
Data risk: Pay attention to the leading indicators of the Conference Board in June. If the data is stronger than expected, it may be bearish for gold in the short term.
Technical correction: If the gold price rises rapidly and then shows a top divergence signal, be alert to the risk of a correction.
Conclusion: Gold is in a bullish trend as a whole. The operation is mainly to go long after the retracement. Focus on the support area of 3340-3330. A breakthrough above 3375 will open up more room for growth.
Free Signals:t.me/+CXftl_-QHEo2Yzc0
Disclaimer
The information and publications are not meant to be, and do not constitute, financial, investment, trading, or other types of advice or recommendations supplied or endorsed by TradingView. Read more in the Terms of Use.
Free Signals:t.me/+CXftl_-QHEo2Yzc0
Disclaimer
The information and publications are not meant to be, and do not constitute, financial, investment, trading, or other types of advice or recommendations supplied or endorsed by TradingView. Read more in the Terms of Use.