Overview:
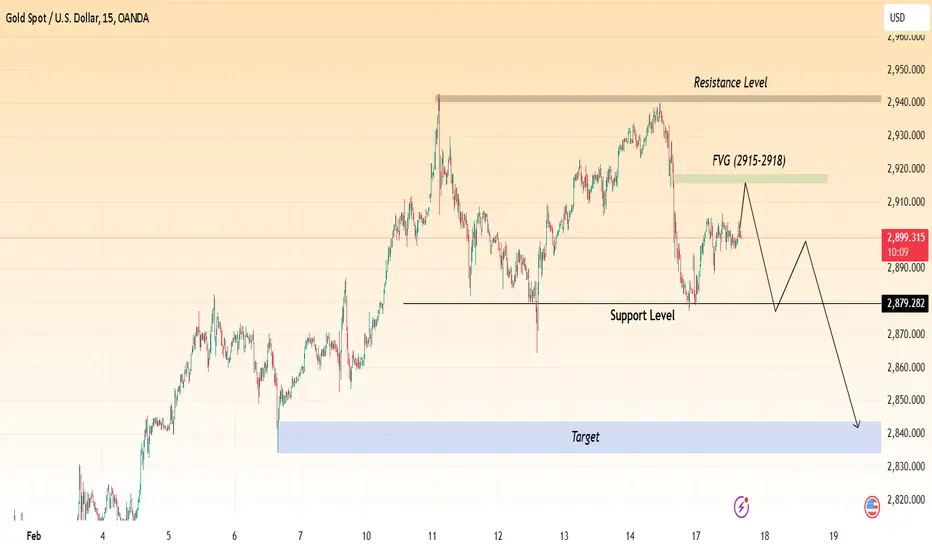
Gold is currently trading around $2,900, showing a potential bearish setup based on key technical levels. The chart highlights an important Fair Value Gap (FVG), support and resistance levels, and a possible price movement scenario.
Key Levels:
🔸 Resistance Zone: $2,940 - $2,950
A strong supply zone where price previously reversed.
If price reaches this level, sellers might step in.
🔸 Fair Value Gap (FVG: $2,915 - $2,918)
A price imbalance that could act as a short-term resistance.
If price taps into this zone, it may reject downward.
🔸 Support Level: $2,879
A key horizontal level that has acted as support before.
If price holds here, a bounce is possible.
A break below could trigger further downside movement.
🔸 Target Zone: $2,840 - $2,830
A demand zone where buyers could re-enter.
Projected Price Movement:
📉 Bearish Scenario (Main Outlook):
1️⃣ Price moves into FVG ($2,915 - $2,918) and rejects.
2️⃣ Drops towards support at $2,879 for a retest.
3️⃣ A break below $2,879 confirms further downside.
4️⃣ Targeting the $2,840 - $2,830 zone.
📈 Bullish Invalidations:
If price breaks and holds above $2,920, it could push higher toward $2,940 - $2,950 resistance.
A breakout above $2,950 would shift bias to bullish.
How to Use This on TradingView:
✅ Look for bearish signals (rejection wicks, strong red candles) near FVG before shorting.
✅ Watch for a breakdown below $2,879 to confirm further downside.
✅ If price holds above $2,920, reconsider bearish bias.
Related publications
Disclaimer
The information and publications are not meant to be, and do not constitute, financial, investment, trading, or other types of advice or recommendations supplied or endorsed by TradingView. Read more in the Terms of Use.
Related publications
Disclaimer
The information and publications are not meant to be, and do not constitute, financial, investment, trading, or other types of advice or recommendations supplied or endorsed by TradingView. Read more in the Terms of Use.