Gold has made its next move, and it was quite sharp. I was expecting a smoother correction with a return to the manipulation zone, but Gold followed a different scenario, which I described at the end of my last gold analysis:
The closed red daily candle, which completely engulfed the preceding bullish one, showed that the move was, in fact, an internal liquidity sweep. The price has not yet managed to break out of the range. Therefore, when I wrote "Gold has practically confirmed its breakout from the global range", the daily candle had not yet closed, and the price had not secured its position above the range's upper boundary.
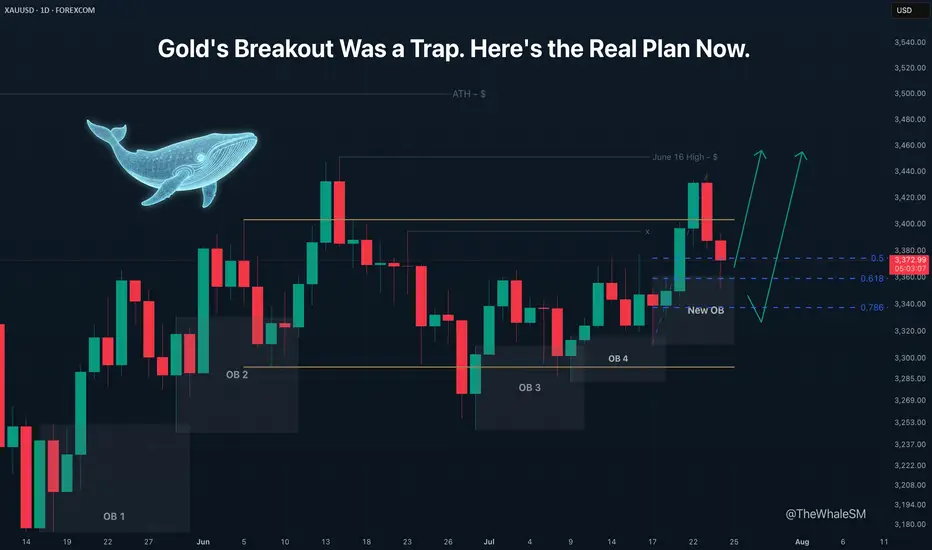
Essentially, it's not important how the price arrives at a Point of Interest (POI). What matters is what we have now: the price has mitigated a manipulation in the form of a new daily order block that was formed inside the range.
Although the middle of a range is a highly unpredictable area for price movement, and I almost never consider it for entries, in this case, there is a strong exception that allows us to consider longs from this order block. The reason for this exception is the bullish order flow on the daily structure, which I have mentioned several times, and the ascending daily structure within the range. This structure allows us to identify the start of the last impulse and draw Fibonacci retracement levels, which will serve as an additional condition for our potential long setup. We can now see that the price has reached the 61.8% Fib level and has shown a reversal reaction to it. To see more precisely if there is a potential entry point, let's switch to the 4H timeframe.

On the 4H chart, we see that the 61.8% level has held, and we can look for entry confirmation on a lower timeframe. The 4H timeframe also shows that the liquidity sweep created a supply zone, which will act as resistance on the path of the next attempt to break out of the range. Due to this zone, considering a long from the current position is not optimal because the risk-to-reward ratio is too small. Furthermore, the price could reject from this supply zone and continue its correction to the next level, the 78.6% Fib level. To find an entry with a more acceptable R:R, let's move to the lower timeframes.

Two Potential Long Scenarios
~~~~~~~~~~~~~~~~~~~~~~~~~~~~~~~~~~~~~~~~~~~~~~~~~~~~~~~~~~~~~~~~~
The principles and conditions for forming the manipulation zones I show in this trade idea are detailed in my educational publication, which was chosen by TradingView for the "Editor's Picks" category and received a huge amount of positive feedback from this wonderful, advanced TV community. To better understand the logic I've used here and the general principles of price movement in most markets from the perspective of institutional capital, I highly recommend checking out this guide if you haven't already. 👇

P.S. This is not a prediction of the exact price direction. It is a description of high-probability setups that become valid only if specific conditions are met when the price reaches the marked POI. If the conditions are not met, the setups are invalid. No setup has a 100% success rate, so if you decide to use this trade idea, always use a stop-loss and proper risk management. Trade smart.
~~~~~~~~~~~~~~~~~~~~~~~~~~~~~~~~~~~~~~~~~~~~~~~~~~~~~~~~~~~~~~~~~
If you found this analysis helpful, support it with a Boost! 🚀
Have a question or your own view on this idea? Share it in the comments. 💬
► Follow me on TradingView to get real-time updates on THIS idea (entry, targets & live trade management) and not to miss my next detailed breakdown.
~~~~~~~~~~~~~~~~~~~~~~~~~~~~~~~~~~~~~~~~~~~~~~~~~~~~~~~~~~~~~~~~~
Gold has practically confirmed its breakout from the global range it has been in since the beginning of June. The only thing that could prevent this is a complete engulfing of the bullish daily candle that broke the upper boundary of the range by a bearish candle, but I consider this an unlikely scenario.
The closed red daily candle, which completely engulfed the preceding bullish one, showed that the move was, in fact, an internal liquidity sweep. The price has not yet managed to break out of the range. Therefore, when I wrote "Gold has practically confirmed its breakout from the global range", the daily candle had not yet closed, and the price had not secured its position above the range's upper boundary.
Essentially, it's not important how the price arrives at a Point of Interest (POI). What matters is what we have now: the price has mitigated a manipulation in the form of a new daily order block that was formed inside the range.
Although the middle of a range is a highly unpredictable area for price movement, and I almost never consider it for entries, in this case, there is a strong exception that allows us to consider longs from this order block. The reason for this exception is the bullish order flow on the daily structure, which I have mentioned several times, and the ascending daily structure within the range. This structure allows us to identify the start of the last impulse and draw Fibonacci retracement levels, which will serve as an additional condition for our potential long setup. We can now see that the price has reached the 61.8% Fib level and has shown a reversal reaction to it. To see more precisely if there is a potential entry point, let's switch to the 4H timeframe.
On the 4H chart, we see that the 61.8% level has held, and we can look for entry confirmation on a lower timeframe. The 4H timeframe also shows that the liquidity sweep created a supply zone, which will act as resistance on the path of the next attempt to break out of the range. Due to this zone, considering a long from the current position is not optimal because the risk-to-reward ratio is too small. Furthermore, the price could reject from this supply zone and continue its correction to the next level, the 78.6% Fib level. To find an entry with a more acceptable R:R, let's move to the lower timeframes.
Two Potential Long Scenarios
- SCENARIO 1: Entry from the 15M Demand Zone or 15M OB
The 15M timeframe shows a break of the 15M structure and the formation of manipulations in the form of a demand zone and a 15M order block within it.
► Setup Condition: I will consider a long position upon the mitigation of one of these manipulation zones and a clear reversal reaction from it. If the price continues to move up from the current levels, I will not enter due to the large stop loss required and the suboptimal R:R to the nearest resistance.
► Invalidation: A break below these support zones on the lower timeframe will invalidate this scenario. - SCENARIO 2: Entry from the 78.6% Fib Level
This scenario becomes active if the first one fails.
► Setup Condition: If the price breaks the 15M supports, I will watch for its interaction with the 78.6% Fib level. For a potential entry, this level must hold, show a reversal reaction, and be followed by confirmation on a lower timeframe.
► Invalidation: A decisive close below the 78.6% Fib level.
~~~~~~~~~~~~~~~~~~~~~~~~~~~~~~~~~~~~~~~~~~~~~~~~~~~~~~~~~~~~~~~~~
The principles and conditions for forming the manipulation zones I show in this trade idea are detailed in my educational publication, which was chosen by TradingView for the "Editor's Picks" category and received a huge amount of positive feedback from this wonderful, advanced TV community. To better understand the logic I've used here and the general principles of price movement in most markets from the perspective of institutional capital, I highly recommend checking out this guide if you haven't already. 👇
P.S. This is not a prediction of the exact price direction. It is a description of high-probability setups that become valid only if specific conditions are met when the price reaches the marked POI. If the conditions are not met, the setups are invalid. No setup has a 100% success rate, so if you decide to use this trade idea, always use a stop-loss and proper risk management. Trade smart.
~~~~~~~~~~~~~~~~~~~~~~~~~~~~~~~~~~~~~~~~~~~~~~~~~~~~~~~~~~~~~~~~~
If you found this analysis helpful, support it with a Boost! 🚀
Have a question or your own view on this idea? Share it in the comments. 💬
► Follow me on TradingView to get real-time updates on THIS idea (entry, targets & live trade management) and not to miss my next detailed breakdown.
~~~~~~~~~~~~~~~~~~~~~~~~~~~~~~~~~~~~~~~~~~~~~~~~~~~~~~~~~~~~~~~~~
Note
UPDATE: GoldJust sharing my thoughts on the current situation with Gold. With the NY session coming to a close in about an hour, I’m done trading for today — any potential entries will only be considered tomorrow.
The price did not have time to show a proper entry confirmation today. It did mitigate the 15m demand zone, but I was waiting for a deeper push into it, at least into the FVG before the 15m OB. In any case, no proper entries can be considered for today. The probability of an entry based on the first scenario has significantly decreased because the Asian session is ahead, and it's unlikely that the current entry conditions on the lower timeframe will remain the same tomorrow. The 15m demand zone is no longer relevant as it has been mitigated; for now, the 15m OB remains active.
We'll need to see how today's daily candle closes tomorrow. If it closes with its body above the 61.8% level, we will then need to look for new entry conditions on the lower timeframe. For now, I'm waiting to see how the price reveals itself tomorrow.
What can be said for certain at this moment is that the price has "seen" the new daily order block I mentioned in the main analysis very well — the reversal reaction from it today was very clear. We'll see if it continues to "respect" it tomorrow.
Note
UPDATE: GoldThe 15m Order Block has been broken, and the price is heading towards the next level, the 78.6% Fibonacci retracement. Thus, the first long entry scenario is now almost invalidated. The only thing that could prevent this is if the price reverses from current levels and today's daily candle closes with its body above the 61.8% level, but it seems more likely that the price will reach the 78.6% level today.
When that happens, I will be watching for a reaction to it. An important confirmation for the potential long setup in Scenario 2 would be a liquidity sweep of the low at 3332, followed by the price finding acceptance above the 78.6% level.
Note
UPDATE: GoldThe price has reached the 78.6% retracement level and swept the liquidity from the low at 3332. As we are approaching the end of the final trading day before the weekend, I don't expect any more significant price movements today. There is no longer enough time for the necessary conditions for a setup to form—namely, for the price to find acceptance above the level, which is still holding for now.
Furthermore, it makes no sense to open a trade shortly before the close of the Friday NY session, as you could get caught by a gap if any unforeseen news occurs over the weekend. Since this is a level from the daily structure, a definitive break of it will be confirmed by the daily candles. Thus, the beginning of next week will show more clearly whether the level has held or not.
For now, the second long scenario remains valid, but its potential execution is deferred to the beginning of next week.
Order cancelled
UPDATE: GoldThe first day of the week showed that the price was unable to find acceptance above the 78.6% daily Fibonacci retracement level, and it was ultimately broken. The order block itself acted as liquidity. Overall, there's nothing unusual here, as the price continues to be inside the global range. Within any range, price action is more unpredictable, sweeping liquidity from both sides and often using manipulation zones themselves as liquidity. So, my caution about entering within the range and the associated need to wait for reliable confirmation—like price holding above a key level—proved to be justified this time as well, despite the clear bullish order flow within it.
Thus, the second scenario of the trade idea has also been invalidated, and this trade idea is no longer active. However, I will share my thoughts on possible scenarios for future developments on this asset.
One last chance for a bullish reversal from the current position would be if a liquidity sweep of the local daily BOS level at $3310 is confirmed tomorrow. I call it "local" because this structure began after the June 30th deviation inside the global range. Given the local nature of this BOS and the fact that the price remains inside the range, I consider this level to be weak support for a reversal. Therefore, I will simply keep it in mind and see what happens with it tomorrow.
If this BOS level is also broken, then I expect the price to move towards the significant liquidity at the Previous Month's Low (PML). There are only a few days left until the end of the current month, and if the price approaches it before the month ends, the probability of it being swept will be very high.
► If the PML is swept and the price returns into the range, this would be a deviation, and we could once again consider longs from new manipulation zones formed during this move.
► If, instead of just a sweep, the price continues its bearish move and confirms a breakout to the downside, then I will look for shorts on a pullback.
Until then, I prefer to remain on the sidelines and trade assets that are in more defined market phases than a range.
Related publications
Disclaimer
The information and publications are not meant to be, and do not constitute, financial, investment, trading, or other types of advice or recommendations supplied or endorsed by TradingView. Read more in the Terms of Use.
Related publications
Disclaimer
The information and publications are not meant to be, and do not constitute, financial, investment, trading, or other types of advice or recommendations supplied or endorsed by TradingView. Read more in the Terms of Use.