📊 Chart Breakdown & Market Context:
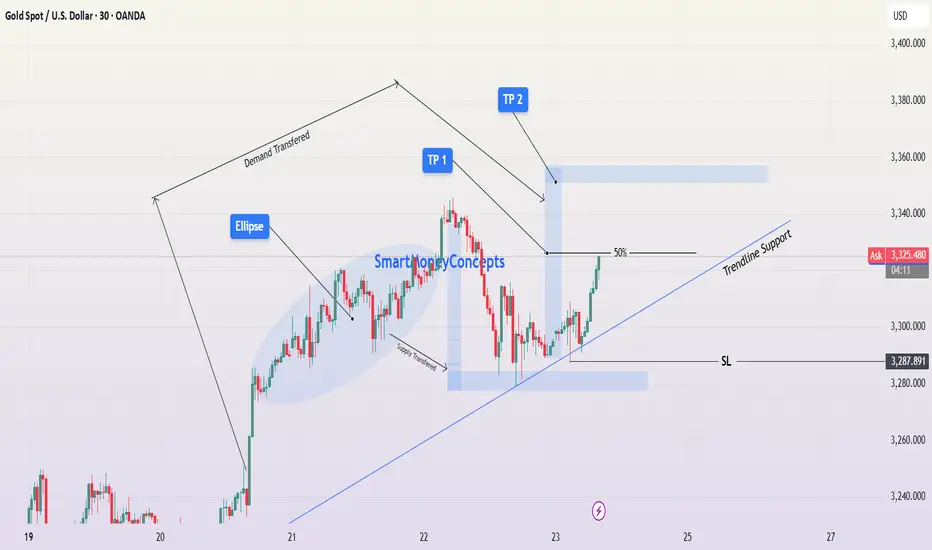
This 30-minute chart of Gold Spot (XAU/USD) shows a strong bullish price structure that is currently forming higher lows while respecting dynamic trendline support. The chart illustrates demand and supply transfers, which are pivotal concepts in price action trading. Let’s explore the technical reasoning behind this trade setup:
🔄 1. Demand & Supply Shift Zones:
Demand Transferred: Initially, price consolidated within the blue elliptical region. This area saw aggressive bullish pressure that pushed price upward, confirming the presence of institutional demand. As the market progressed, this demand shifted higher — now located at the most recent zone where price bounced after a pullback.
Supply Transferred: A major bearish reaction zone was taken out after the market absorbed selling pressure. This suggests that sellers are no longer in control and demand is rebalancing in favor of buyers.
📈 2. Bullish Structure Confirmation:
After the pullback on May 22, price formed a higher low, perfectly aligned with both the new demand zone and the ascending trendline support. This confirms that buyers are defending this area.
The price is currently pushing upward from this demand, signaling a potential bullish continuation.
The 50% equilibrium level of the recent bearish leg is being tested. A clean break and close above this level would confirm buyers’ dominance and could invite momentum trading interest.
🔵 3. Entry, Targets & Stop-Loss Plan:
✅ Entry:
Entry is ideal from the current price region near 3,313 (or on minor retracement, maintaining RR).
🎯 Take Profit Zones:
TP1 (~3,336): This is just above the 50% level and near the previous swing high. Partial take-profit here is wise in case price consolidates.
TP2 (~3,360): Located at the upper resistance zone, marking the potential target if bullish momentum continues.
❌ Stop-Loss:
SL: 3,287.891 — placed below the recent higher low and below the demand zone. This protects the trade from deeper pullbacks or breakdowns below structural support.
📉 4. Risk Management & Trade Psychology:
Maintain a Risk-Reward Ratio (RRR) of at least 1:2 to ensure profitable expectancy.
Avoid over-leveraging, as we are trading near a key resistance zone (50% area).
Watch for volume confirmation or strong bullish candles before fully committing to the trade.
Use a trailing stop once TP1 is hit to secure profits toward TP2.
⚠️ 5. Key Considerations Before Execution:
Monitor any macroeconomic events (e.g., Fed announcements, CPI/PPI, NFP) that may impact gold volatility.
Check DXY (Dollar Index) — if the dollar weakens, gold will likely strengthen further.
Volume behavior around the 50% zone will indicate breakout vs rejection.
🧠 Summary for Minds Section:
Gold shows a clear higher-low structure supported by trendline and demand transfer.
Buyers absorbed supply; now building momentum toward upper resistance zones.
Entry near 3,313, SL under 3,288, TP1 ~3,336, TP2 ~3,360.
Trend remains bullish unless trendline and demand zone are broken.
💡 Educational Takeaway: Watch for demand/supply shifts and trendline confirmations. This setup is a textbook example of structural continuation supported by market psychology and price action zones.
For Daily Trade Setups and Forecast: 📈 t.me/xauusdoptimizer
Premium Signals Fr33: 💯 t.me/xauusdoptimizer
🥰🥳🤩
Premium Signals Fr33: 💯 t.me/xauusdoptimizer
🥰🥳🤩
Related publications
Disclaimer
The information and publications are not meant to be, and do not constitute, financial, investment, trading, or other types of advice or recommendations supplied or endorsed by TradingView. Read more in the Terms of Use.